
Climate Risk at the MSA Level
The fastest-growing metropolitan areas in the United States are disproportionately concentrated in regions facing the most acute climate-related pressures. Sun Belt and Mountain West metros - Phoenix, Las Vegas, Houston, Miami, Tampa, Austin, Dallas, Charlotte, Jacksonville - have attracted millions of new residents and massive commercial and residential real estate investment over the past two decades. Many of these same metros are experiencing serious climate related disruptions, including flood frequency, and wildfire exposure, and long-term water supply constraints, resulting in higher utility, capex, and insurance costs.
Three of the first measurable climate change trends are explored in the charts and text below:
- Property insurance premiums (2011–2025) and insurer-initiated nonrenewals (2022–2024)
- High-tide (nuisance) flooding frequency (2014–2025)
- Lake Mead elevation (2000–2026; representative of the depletion of the Colorado River system - the primary water supply for approximately 40 million people in one of the country’s fastest-growing regions)
Homeowners Insurance Premiums by State (2011–2025)
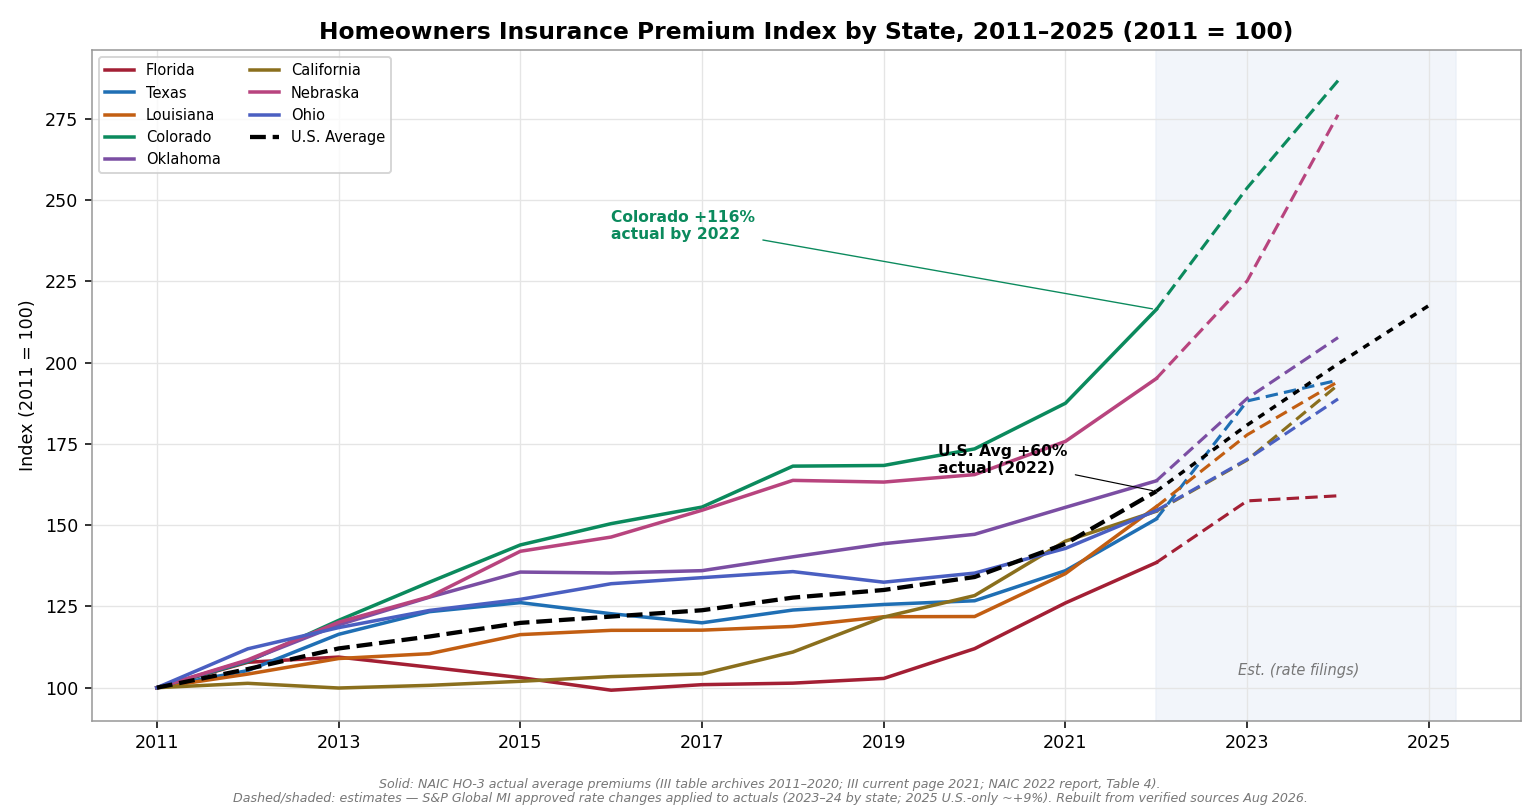
Figure 1. Homeowners insurance premium index by state (2011 = 100). Solid lines through 2022 are actual NAIC HO-3 average premiums, re-keyed from primary sources in August 2026 (III historical table archives for 2011–2021; NAIC 2022 report, Table 4). Dashed lines in the shaded area are estimates: S&P Global Market Intelligence approved rate changes applied to the 2022 actuals (2023–2024 by state; 2025 national only). States exposed to wildfire (Colorado), hurricanes (Louisiana, Florida), and severe convective storms (Oklahoma, Nebraska) diverge sharply from the national average after roughly 2019–2020. Florida’s path is notable: roughly flat 2013–2019, then a steep three-year surge. Sources: NAIC via III table archives (2011–2021); NAIC Data for 2022 report (May 2025); S&P Global MI (2023–25).
Key Observations
Insurance Availability: Company-Initiated Nonrenewals (2022–2024)
Rising premiums are only half of the market adjustment. The other half is availability: whether insurers keep writing and renewing policies at all. The NAIC’s first countrywide analysis of state-collected market conduct data (MCAS), published July 31, 2026, quantifies this side of the market with regulator-collected actuals through 2024. The clearest availability signal in the data: company-initiated nonrenewals nearly doubled nationally between 2022 and 2024.[3]
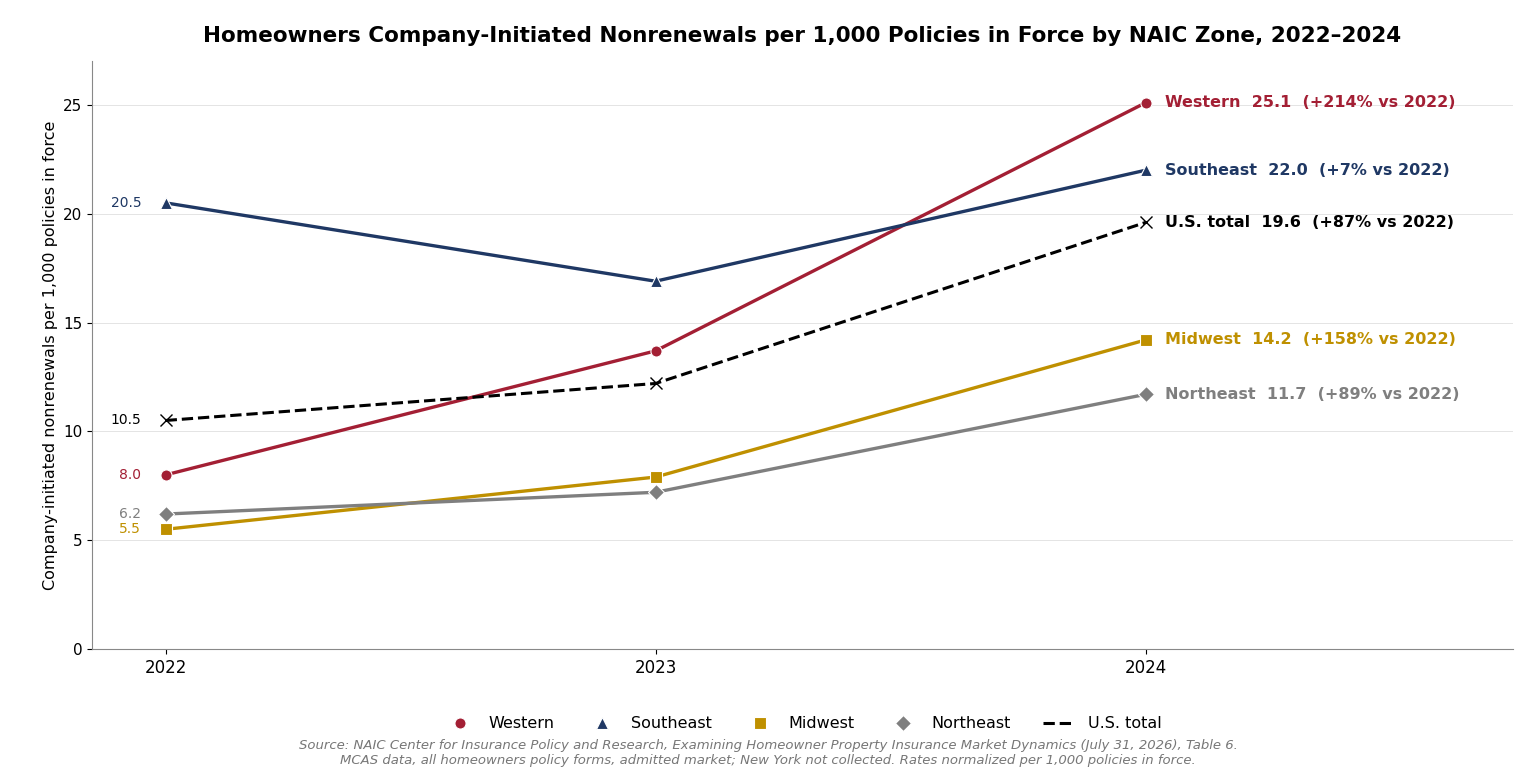
Figure 2. Homeowners company-initiated nonrenewals per 1,000 policies in force by NAIC zone, 2022–2024 (NAIC analysis, Table 6; U.S. total shown dashed). MCAS covers admitted-market carriers writing $50,000+ of premium per state, across all homeowners and dwelling policy forms; New York does not report. Source: NAIC Center for Insurance Policy and Research.[3]
Key Observations
High-Tide Flooding: Observed Station Trends (2014–2025)
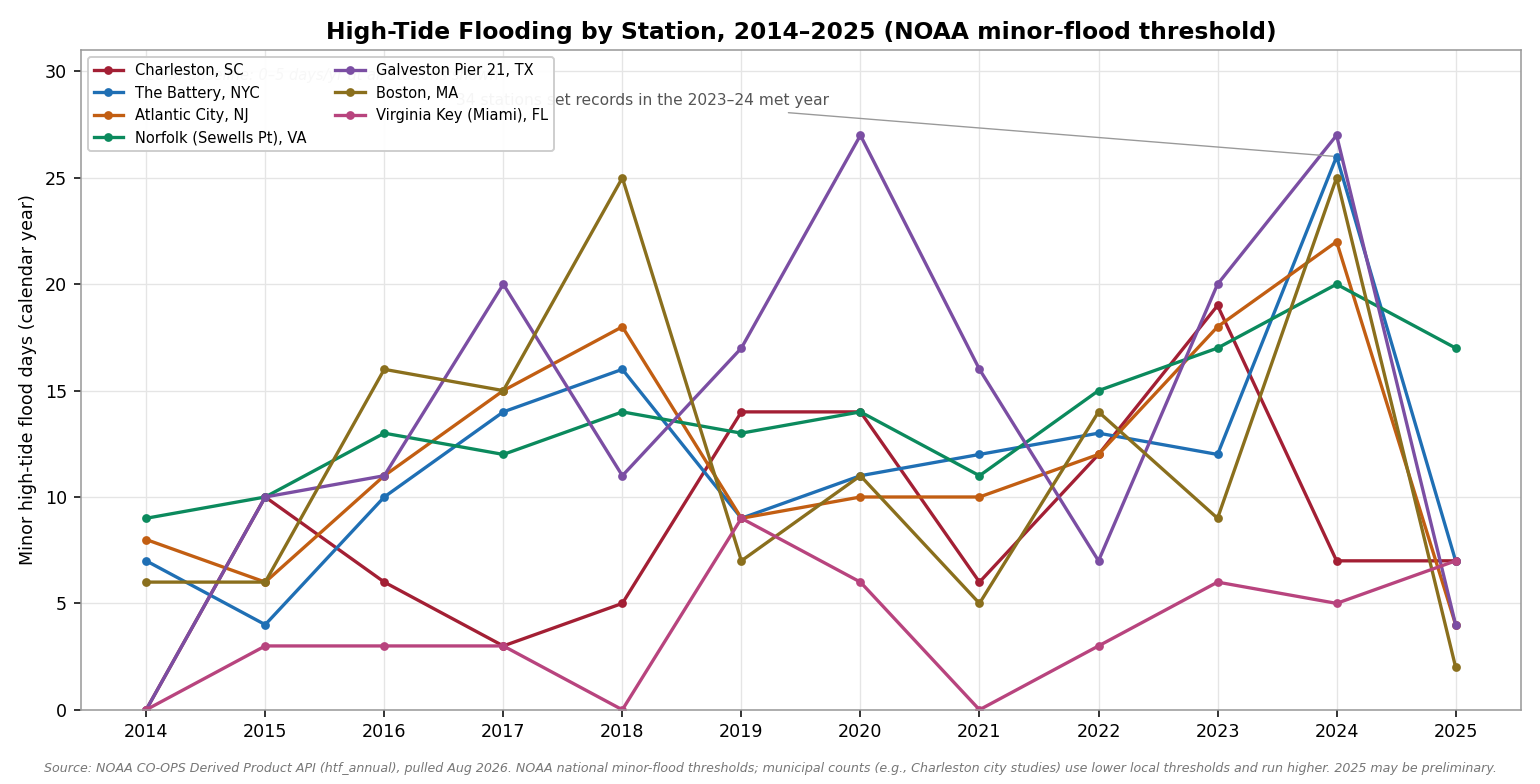
Figure 3. Observed annual minor high-tide flood days at seven NOAA tide stations, 2014–2025 (calendar years, NOAA Derived Product API). High-tide flooding (also called “nuisance” or “sunny day” flooding) occurs when tides reach roughly 1–2 feet above the daily average high tide, causing road closures and property damage even without storms. Year-to-year variability is driven by ENSO cycles, storm activity, and lunar cycles; the underlying upward trend is driven by cumulative sea level rise. In the 2023–24 meteorological year, 34 U.S. stations tied or broke their records. Note: NOAA’s national minor-flood thresholds are conservative - municipal counts using lower local thresholds (e.g., Charleston’s) run higher. Source: NOAA CO-OPS Derived Product API and Annual High Tide Flooding Outlooks.
Key Observations
Context & Discussion
Charleston, SC
Charleston is among the most visible examples of accelerating high-tide flooding in the United States. Two measurement systems tell the same story at different scales. By NOAA’s conservative national minor-flood threshold, the Charleston tide station recorded 1 flood day in 2000, 10 in 2015, and 19 in 2023. By the city’s lower local flood threshold - the basis of an NCCOS-sponsored study - the peninsula flooded roughly 2 days per year in 1950, 25 days per year by 2014 (42 total hours), and 38 days in 2015.[5] A 2019 city vulnerability study found that 70% of all residential properties in Charleston are highly vulnerable to flooding and 80% of the city’s annual sales volume and jobs are highly vulnerable.[6] Half of Charleston’s total sea level rise in the past 100 years occurred in the last 20 years.[6] The city has hired its first Chief Resiliency Officer, installed 22 check valves and backflow preventers to replace failing gravity-based drainage, and updated its flooding strategy to plan for 2–3 feet of elevation increase for new infrastructure.[6]
Miami & Southeast Florida
The vast majority of the Miami metropolitan area sits below 10 feet of elevation. Even a 1-foot increase over the average high tide causes widespread flooding across the metro area.[7] Miami Beach has replaced its gravity-based drainage system with pump systems because the old systems cannot function during high tides - seawater backs up through storm drains before surface flooding is even visible.[7] The Southeast Florida Regional Climate Compact tracks increasing hours above mean high tide across Broward, Miami-Dade, Palm Beach, and Monroe counties, and King Tide events (fall perigean spring tides) now routinely flood roads and properties along the Intracoastal Waterway.[8]
Norfolk / Hampton Roads, VA
Norfolk combines sea level rise with significant land subsidence, making it one of the fastest-sinking populated areas on the East Coast. Sewells Point (home to Naval Station Norfolk, the world’s largest naval base) now regularly records 20+ high-tide flood days per year. The Mid-Atlantic region overall has seen a more than 200% increase in flood days vs. 2000, with an observed median of 17 days in the 2023–24 meteorological year - the highest of any region.[4]
New York & Atlantic City
Atlantic City, NJ and the New York metropolitan area have seen sharp increases in high-tide flood frequency over the past decade. The Battery (Manhattan), Atlantic City, and Kings Point (Long Island Sound) all regularly exceed 20 flood days per year in the mid-2020s - levels that would have been exceptional a decade earlier.[4]
Galveston & the Western Gulf
The Western Gulf coast regularly records 20+ high-tide flood days per year at stations including Galveston and Eagle Point, TX. The region’s ~300% increase vs. 2000 is driven by the combination of sea level rise and land subsidence, which is particularly acute along the western reaches of the Gulf Coast.[4]
Lake Mead: Water Supply Under Pressure (2000–2026)
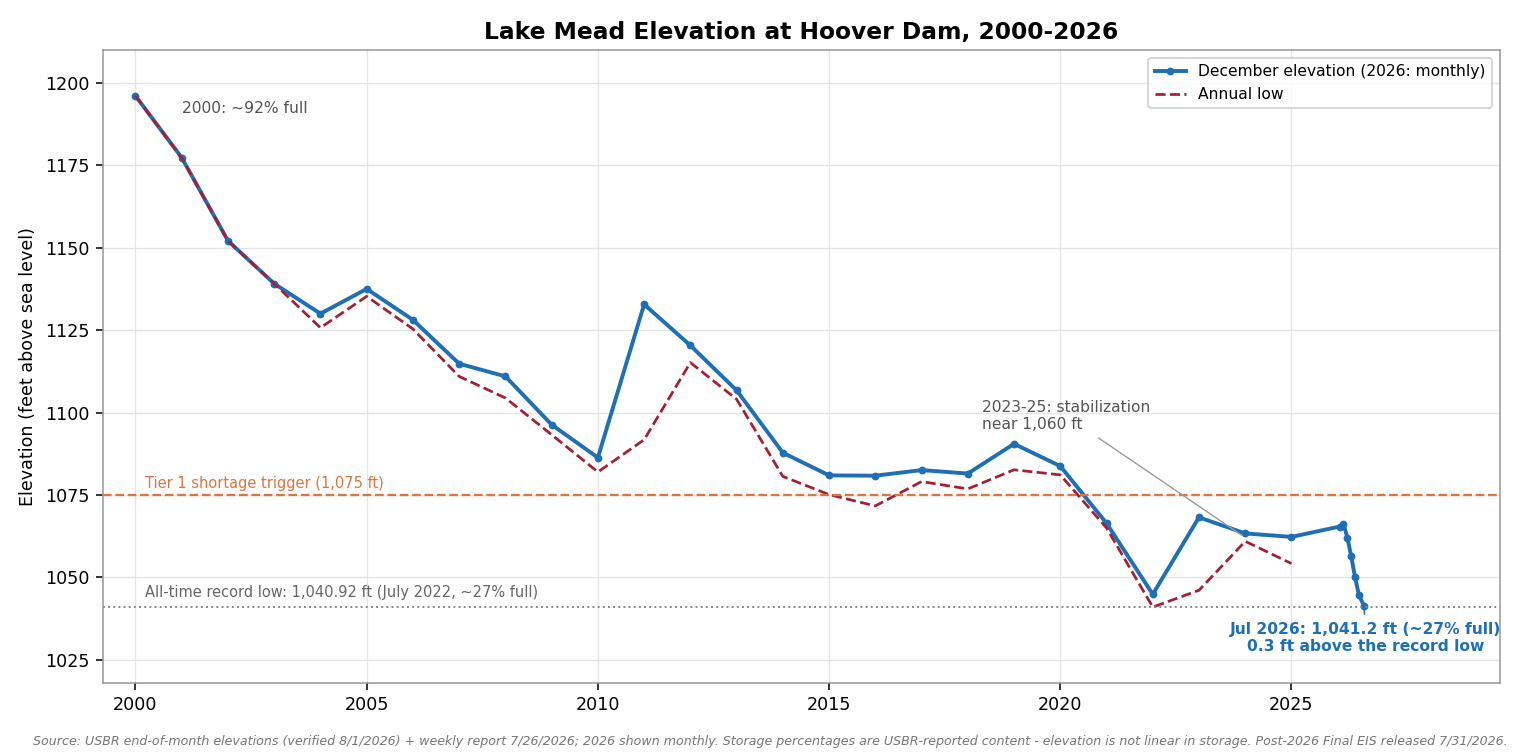
Figure 4. Lake Mead elevation at Hoover Dam, 2000–2026 (December year-end, annual low, and 2026 monthly). The reservoir declined from ~92% of capacity in 2000 to a record low of 1,040.92 feet (~27% of capacity) in July 2022 - its lowest level since initial filling in 1937. Conservation agreements and a wet 2023 winter produced a brief recovery, but a poor 2026 snowpack erased it: by late July 2026 the reservoir stood at 1,041.2 feet (~27% full), within a third of a foot of the all-time record. Note that storage does not scale linearly with elevation - percentages shown are Reclamation-reported contents. The orange line marks the 1,075-foot Tier 1 Shortage trigger, below which mandatory delivery cuts apply to Arizona and Nevada. Source: U.S. Bureau of Reclamation (elevations verified 8/1/2026).[9]
Key Observations
Context & Discussion (continued)
The Colorado River Basin & Dependent Populations
The Colorado River system supplies water to approximately 40 million people across seven states and Mexico, irrigates roughly 5.5 million acres of farmland, and generates hydroelectric power at multiple dams. Lake Mead and Lake Powell are the system’s two largest reservoirs, with a combined capacity of approximately 50 million acre-feet. The system went from 95% full in 2000 to near-record lows by 2022; in July 2026, combined Mead–Powell storage set a new record low. The 25-year period from 2000 to 2024 was the driest in over 1,200 years of record-keeping, based on paleoclimate reconstructions.[10] Western snowpack - a critical source of reservoir inflows - has grown increasingly volatile. Sierra Nevada snowpack, which supplies roughly 30% of California’s water, reached its lowest level in 500 years in April 2015 (5% of average statewide; no snow at the Phillips Station survey site), then swung to 237% of average in 2023, held near average in 2024–25 (110% and 96%) - and collapsed again in 2026 to 18%, the second-lowest April 1 reading on record, with Phillips again snowless after record March heat melted the pack a month early.[12]
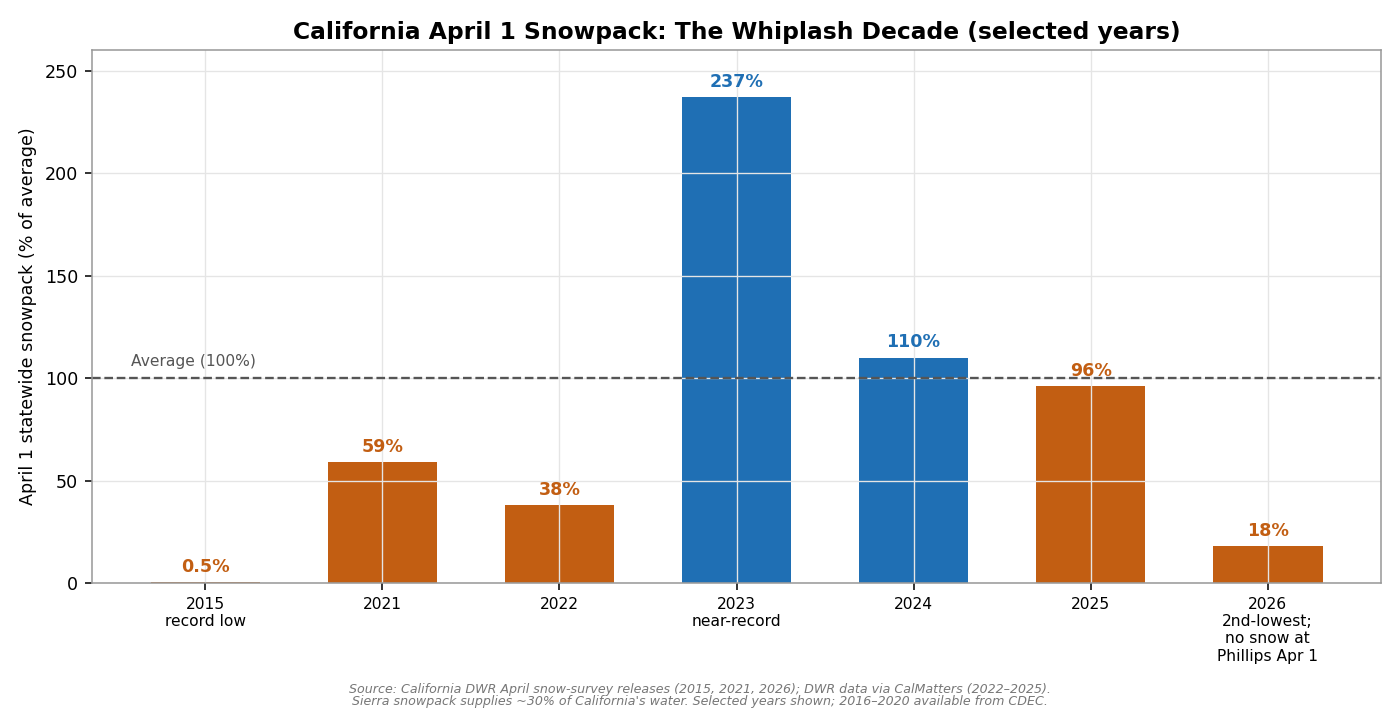
Figure 5. California April 1 statewide snowpack, percent of average (selected years). The swing from 5% (2015) to 237% (2023) to 18% (2026) illustrates why “average” is becoming a poor planning assumption for Western water supply - and why reservoir storage and groundwater rules, not annual precipitation, are the binding constraints for development. Sources: California DWR April snow surveys; DWR data via CalMatters.[12]
Southern Nevada (Las Vegas) has adapted more aggressively than most Colorado River users. The Southern Nevada Water Authority implemented tiered water pricing, removed over 200 million square feet of ornamental grass, and recycled nearly all indoor water back to Lake Mead. Per-capita water consumption in Las Vegas declined roughly 47% from 2002 to 2022 even as the metro population grew significantly. Despite these efforts, Nevada’s Colorado River allocation (300,000 acre-feet per year) is the smallest of the three Lower Basin states and is subject to shortage-tier cuts.[10]
Arizona faces the most direct impact from Colorado River reductions. The Central Arizona Project (CAP) aqueduct delivers approximately 1.5 million acre-feet per year from Lake Mead to Phoenix, Tucson, and agricultural users in Central Arizona. Under shortage conditions, Arizona absorbs the largest mandatory delivery reductions among Lower Basin states. In parallel, the Arizona Department of Water Resources determined in June 2023 that all physically available groundwater in the Phoenix Active Management Area is fully allocated, meaning new suburban subdivisions outside of designated municipal service areas can no longer rely on local groundwater to meet the state’s 100-year Assured Water Supply requirement.[11]
Next: Phoenix - Water, Growth & Industrial Demand
The Phoenix metropolitan area sits at the intersection of multiple water supply constraints: declining Colorado River allocations, fully allocated groundwater, and a 100-year assured water supply framework that is actively being renegotiated. At the same time, Phoenix is attracting significant water-intensive industrial investment - semiconductor fabrication facilities (TSMC, Intel), hyperscale data centers, and advanced manufacturing - all of which require reliable water and electricity in a region where both are under increasing pressure. The next page in this section examines Phoenix as a case study in the tension between Sun Belt growth and long-term resource sustainability.
What to Watch in 2026
Sources to Track Climate Risk at the MSA Level:
| Source | Next Release | Date | Notes |
|---|---|---|---|
| NAIC / Insurance Information Institute | State-level HO-3 avg premiums for 2023 | Not yet released as of Aug 2026; expected late 2026 | Will fill the 2023 gap between NAIC actuals and S&P rate-filing estimates. The NAIC’s MCAS market analysis (July 2026) already provides zone-level actuals through 2024 (Figure 2), but not state HO-3 averages |
| NAIC homeowner property insurance market data call | ZIP-code-level premiums, claims, losses, deductibles, nonrenewals (launched March 2026) | First analysis expected 2027 | Will provide the first true sub-state (ZIP/MSA-level) view of insurance cost and availability; the successor dataset for this page’s MSA-level question |
| U.S. Bureau of Reclamation | Lake Mead monthly elevation update | Monthly (ongoing) | Track whether the 2027 runoff season (after the failed 2026 snowpack) stabilizes or further depletes reservoir storage |
| Bureau of Reclamation | Post-2026 Operating Rules - Final EIS released 7/31/26; Record of Decision | ROD expected late 2026 | Will determine shortage-tier delivery cuts for AZ, NV, and CA; the Aug 2026 24-Month Study sets the 2027 shortage tier |
| NOAA CO-OPS | 2026–27 High Tide Flooding Outlook | Annual (typically July–Aug) | Will show whether post-El Niño flood frequency remains elevated or reverts toward baseline |
| California DWR / USDA NRCS | April 1 Sierra Nevada snow survey | Annual, April 1 (next: April 2027) | Peak snowpack measurement; key indicator for CA water supply and reservoir inflows |
Notes
[1] National Association of Insurance Commissioners (NAIC). Dwelling Fire, Homeowners Owner-Occupied, and Homeowners Tenant and Condominium/Cooperative Unit Owner’s Insurance Report: Data for 2022 (May 2025); historical state tables 2011–2021 via Insurance Information Institute table archives. Series re-keyed from primary sources, August 2026. iii.org ↩
[2] S&P Global Market Intelligence, RateWatch. Annual homeowners rate filing data (2019–2024), as republished by insurance.com (data as of Dec 2024) and Insurance Journal (Jan 2025). 2025 outlook: Matic, 2026 Home Insurance Predictions (Dec 2025); AM Best; Florida Office of Insurance Regulation. ↩
[3] Czajkowski, J. and P. Harms, NAIC Center for Insurance Policy and Research. Examining Homeowner Property Insurance Market Dynamics – An Assessment of Countrywide State-Level Data From 2018 to 2024 (July 31, 2026). MCAS data fields: policies in force, direct premium written, claims closed with payment, company-initiated nonrenewals and cancellations, nonpayment cancellations. MCAS aggregates are zone-level, span all homeowners and dwelling policy forms (HO-1 through HO-8 and DP), and exclude New York and surplus-lines carriers (about 1.9% of the market); they are a parallel corroborating series, not comparable to the state-level HO-3 averages in Figure 1. The NAIC’s ZIP-code-level homeowner property insurance market data call (launched March 2026) will provide the first sub-state view of premiums, claims, deductibles, and nonrenewals. content.naic.org (report PDF); press release ↩
[4] NOAA Center for Operational Oceanographic Products and Services. Annual High Tide Flooding Outlooks (2015–2025) and Derived Product API (station-level annual flood days, pulled Aug 2026). tidesandcurrents.noaa.gov ↩
[5] Morris, J.T. and K.A. Renken, 2020. “Past, Present, and Future Nuisance Flooding on the Charleston Peninsula.” PLoS ONE 15(9): e0238770. NCCOS Effects of Sea Level Rise Program. ↩
[6] City of Charleston. FloodStat. charleston-sc.gov/floodstat ↩
[7] Wikipedia. Tidal Flooding (Miami Beach section); NOAA. ↩
[8] Southeast Florida Regional Climate Compact. Climate Indicators - High Tide Flooding. southeastfloridaclimatecompact.org ↩
[9] U.S. Bureau of Reclamation. Historical Reservoir Levels: Lake Mead at Hoover Dam (updated monthly; data through July 2026, incl. weekly report of 7/26/2026). usbr.gov ↩
[10] Congressional Research Service. Management of the Colorado River: Water Allocations, Drought, and the Federal Role (R45546, updated 2025). congress.gov ↩
[11] Congressional Research Service. Responding to Drought in the Colorado River Basin (IN11982, updated 2026); Arizona Dept. of Water Resources, Phoenix AMA Groundwater Model (June 2023). congress.gov ↩
[12] Belmecheri, S. et al. (2015). “Multi-century evaluation of Sierra Nevada snowpack.” Nature Climate Change 5, 929–932. California Dept. of Water Resources snow surveys (April 1 SWE, 1900s–present). USDA NRCS, Lower Colorado River Basin SWE report (Feb 2025); California DWR news releases, April 2015, April 2021, and April 1, 2026 (“Record Hot, Dry March Wipes Out California Snowpack”); CalMatters, “California snowpack is near-average” (April 2025). cdec.water.ca.gov ↩
Companion workbook. climate-change-all-data.xlsx - rebuilt from verified primary sources (Aug 2026), with embedded charts - insurance premiums for all 50 states, high-tide flooding frequency, Lake Mead elevation, CO₂ and temperature data, sea level rise, ice sheet mass. climate-msa-effects-insurance-availability.xlsx - NAIC MCAS zone-level nonrenewal, cancellation, and premium tables, 2018–2024 (built Aug 2026).