
CRE42 Industrial REIT Composite[1]
Data: EastGroup Properties, First Industrial Realty Trust, and STAG Industrial, FY2025 Form 10-K and Q4 2025 Supplemental filings; CoStar market data, March 2026.
This section uses a representative cross-section of Industrial Real Estate Investment Trusts to illustrate the most important aspects of the current U.S. industrial real estate cycle from 2016 through 2025.
REITs: EastGroup (EGP), First Industrial Realty (FR), STAG Industrial (STAG)
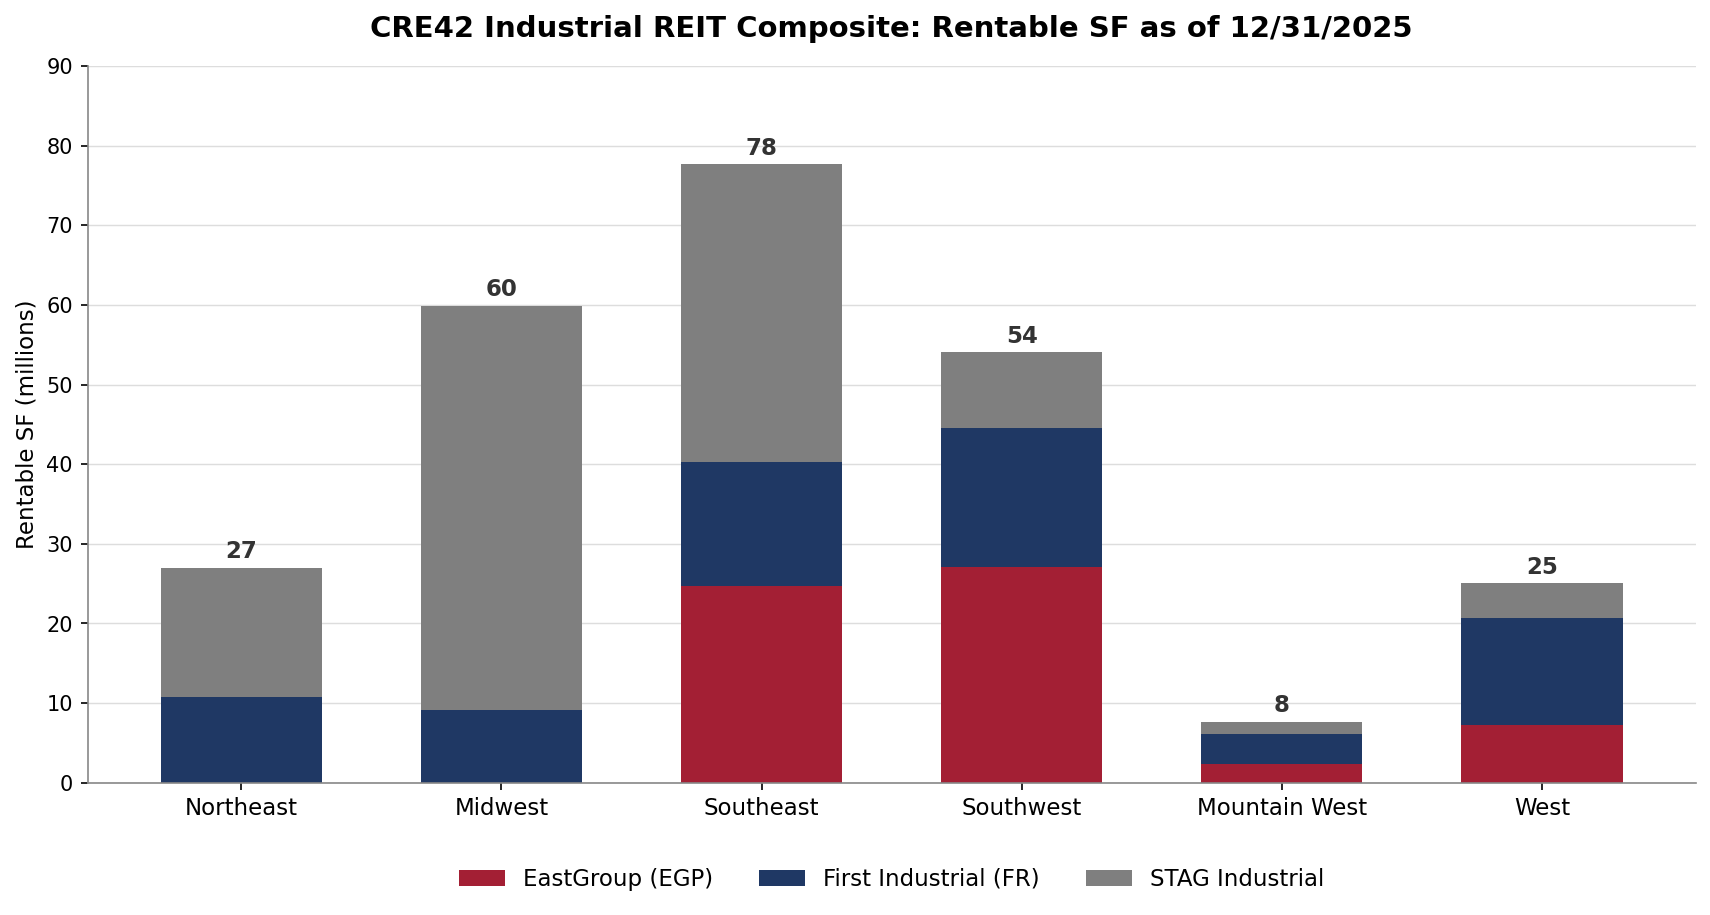
Source: Component FY2025 Form 10-K property tables and Q4 2025 Supplemental filings; CRE42 regional mapping.[2]
Selected Industrial REITs
EastGroup Properties owns 61.6 million operating SF in 550 properties across 12 states, all of it in the Sunbelt: Texas is roughly 37% of the portfolio and Florida roughly 24%. The format is shallow-bay, multi-tenant business parks in infill submarkets: about 1,700 leases averaging roughly 35,000 SF each, at an average base rent of $8.81 per SF, the highest of the three.
First Industrial owns 69.9 million in-service SF in 414 properties across 19 states, the most evenly spread of the three. Southern California is its largest single concentration (11.5 million SF, about 16% of GLA), followed by the Central and Eastern Pennsylvania corridor, Dallas–Fort Worth, Phoenix, and Chicago. The portfolio is regional and bulk distribution: average lease roughly 75,000 SF at $8.41 per SF.
STAG Industrial owns 120.0 million SF in 601 buildings across 41 states, the broadest footprint and the largest SF base. The concentration is Midwest (42% of SF) and Southeast (31%), in secondary markets. The format is single-tenant big box: average building roughly 200,000 SF, average lease roughly 148,000 SF, at $5.96 per SF, the lowest of the three. Its largest tenant (Amazon) is 2.8% of annualized base rent.
Regional Composition of Each Portfolio
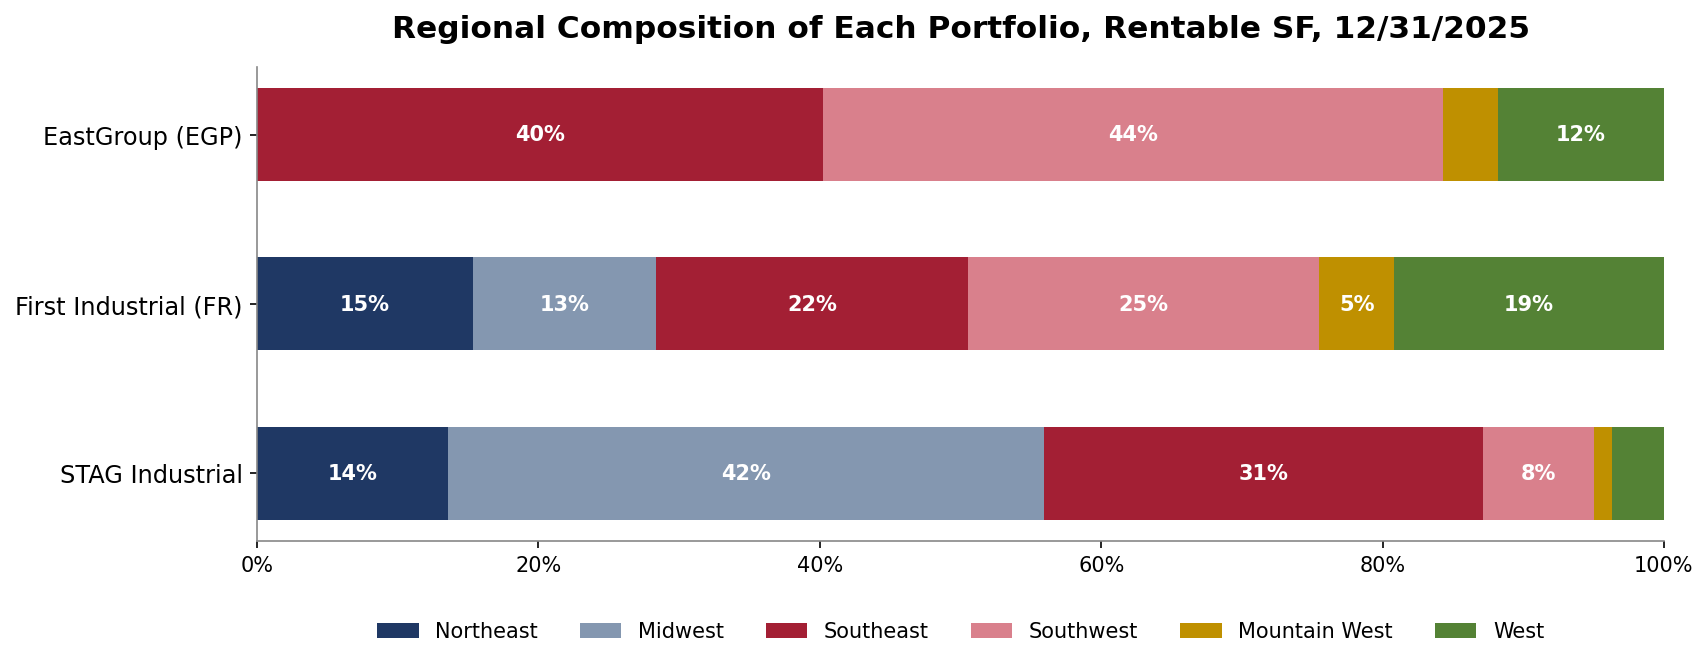
Source: Component FY2025 Form 10-K property tables and Q4 2025 Supplemental filings; CRE42 regional mapping.[2]
Portfolio Details and Comparison
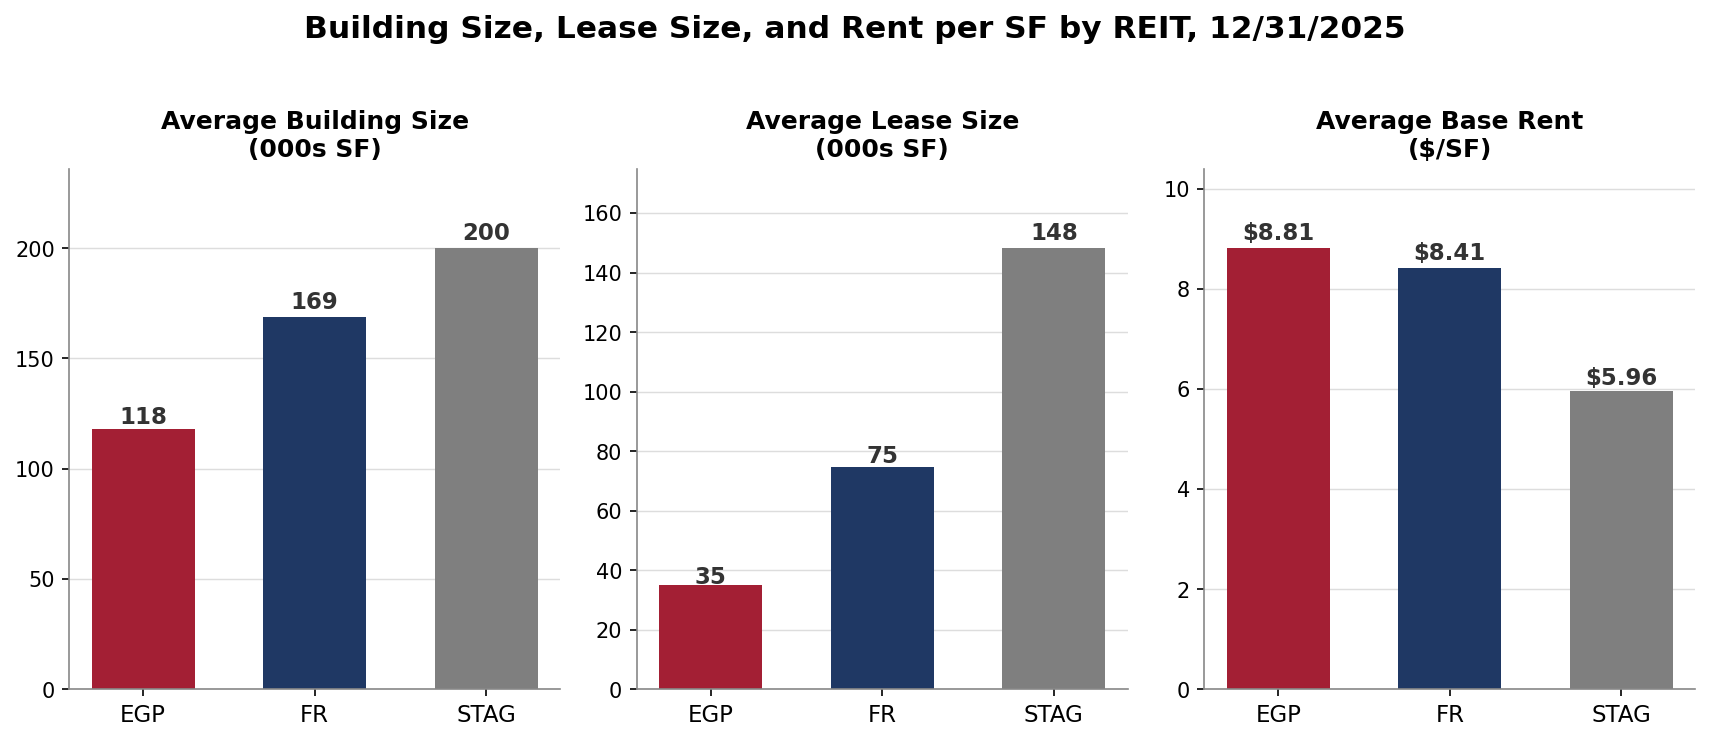
Source: Component FY2025 Form 10-K filings; derived figures per the companion workbook.
| Attribute (12/31/2025) | EastGroup (EGP) | First Industrial (FR) | STAG Industrial | Combined |
|---|---|---|---|---|
| Buildings / properties | 550 | 414 | 601 | 1,565 |
| Rentable SF (mm) | 65.0 | 69.9 | 120.0 | 254.9 |
| States | 12 | 19 | 41 | n/a |
| Percent leased / occupied | 97.0% | 94.4% | 96.4% | 96.0% |
| Number of leases | ~1,700 | 879 | 780 | 3,359 |
| Annualized base rent ($mm) | $559 | $554 | $689 | $1,802 |
| Avg base rent per SF | $8.81 | $8.41 | $5.96 | n/a |
| Avg building size (SF) | 118,000 | 169,000 | 200,000 | 163,000 |
| Avg lease size (SF) | 34,900 | 74,800 | 148,200 | n/a |
| Max single tenant (% of ABR) | 1.5% | 6.4% | 2.8% | n/a |
| 2025 rent change, new + renewal | 40.1% | 53.3% | 38.2% | n/a |
Source: each company's FY2025 Form 10-K and Q4 2025 Supplemental. Count and metric bases differ across filers; see the companion workbook Sources tab and notes [3] and [4].
Composite Portfolio Summary
The combined 254.9 million SF is roughly 1% of the 22.6 billion SF CoStar tracks across the 75 largest U.S. industrial markets, sampled across all six regions and across the full format range: shallow-bay multi-tenant, regional and bulk distribution, and single-tenant big box. The composite is generally well balanced: measured by stabilized total enterprise value, the 2025 weights are roughly 35% EastGroup, 30% First Industrial, and 35% STAG, and no component falls outside roughly 29–40% in any year from 2016 through 2025.[5]
Notes
[1] Prologis, the sector's largest company, was excluded due to meaningful international exposure (CRE42 covers only the U.S. market), significant accounting discrepancies, and adjacent businesses (logistics services and asset management) whose fee income complicates a clean read on U.S. property NOI. Rexford Industrial is concentrated in a single market (Southern California), so its pricing is a regional bet rather than a national signal. Terreno Realty holds coastal infill assets with substantial covered-land and redevelopment value that in-place NOI does not capture. The three components chosen are all US-only, calendar-year filers with in-place income portfolios, so a NOI-based implied cap rate reads cleanly across all three. The composite is overweight the South and underweight the West against national stock, with little exposure to the Inland Empire, the country's largest logistics submarket, outside First Industrial's Southern California holdings. And institutional REIT portfolios run tighter than the market: the composite was 96.0% leased at year-end 2025 against roughly 92.5% national occupancy in CoStar's data. ↩
[2] CRE42 maps states to six regions (Northeast, Midwest, Southeast, Southwest, Mountain West, West); the mapping is documented in the companion workbook. CoStar reports four regions for the 75 U.S. markets with 100 million SF or more of inventory; for comparison, CRE42's Southeast and Southwest map to CoStar's South, and Mountain West maps to West. EastGroup's unitemized "Other Markets" SF (1.9 million SF) is allocated across its four non-core markets pro rata by Schedule III gross cost; all four fall in the Southeast. ↩
[3] Operating and in-service portfolios as of December 31, 2025; development and value-add properties excluded. Building and property counts use each filer's own basis (STAG buildings; FR in-service properties; EGP properties as reported, with regional building lines from Form 10-K Schedule III). SF is rentable or gross leasable area and is comparable across the three. Source: each company's FY2025 Form 10-K and Q4 2025 Supplemental. ↩
[4] Rent-change bases differ: EastGroup reports a GAAP-basis change, First Industrial a straight-line change, and STAG separate new and renewal straight-line changes, blended SF-weighted here. All are twelve-month new-plus-renewal figures for 2025. ↩
[5] TEV weights use each component's stabilized total enterprise value: equity market capitalization plus total property debt, less development and land value. CRE42-defined measure; full derivation in the companion annual-model workbook, component filings FY2016–FY2025. ↩
Companion workbook. industrial-reit-composite.xlsx – Portfolio construction matrix, regional footprint detail by state and metro, and native charts. Component FY2025 Form 10-K and Q4 2025 Supplemental filings.
Companion workbook. industrial-reit-metrics.xlsx – CRE42 industrial REIT composite annual model (FY2016–FY2025), per-REIT and vs-market tabs, and market comparison data.