Source: CoStar multifamily national series, as loaded in the companion workbook (July 2026).
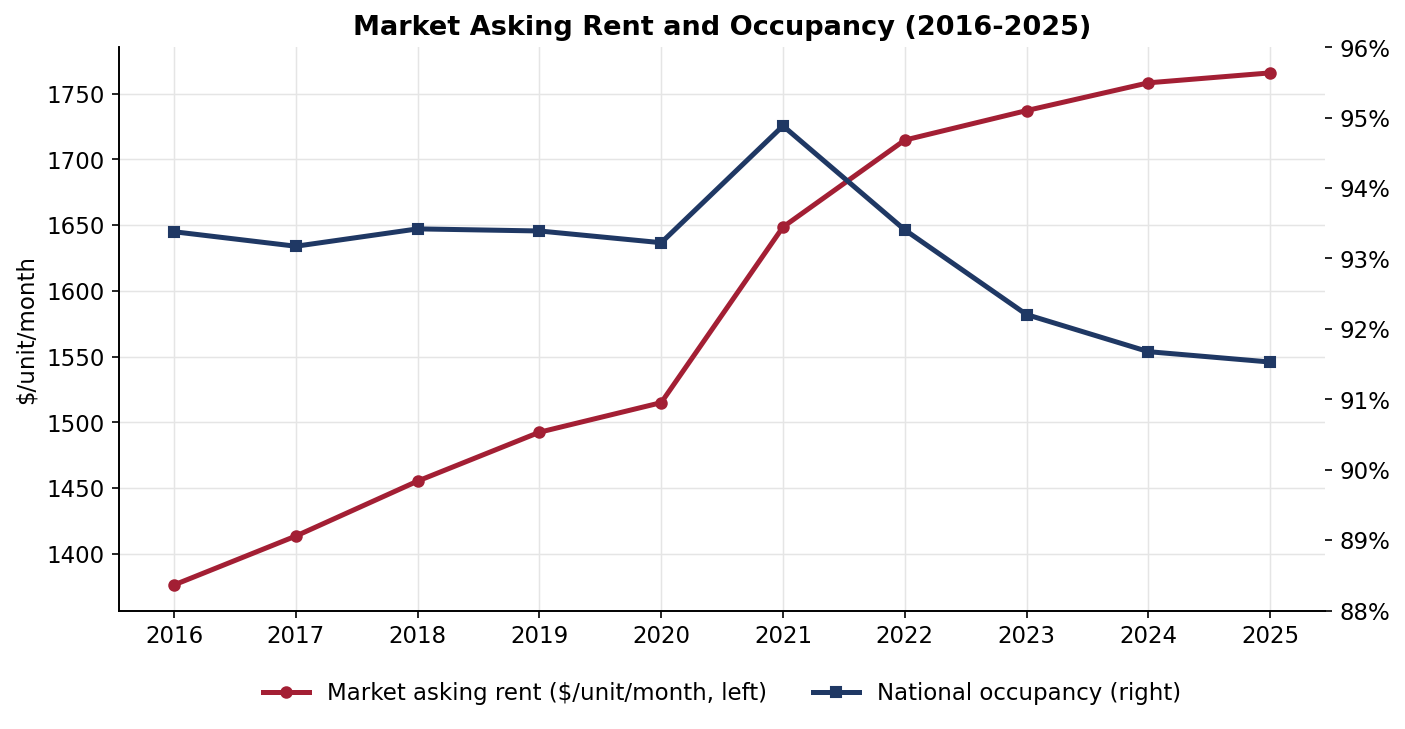
Asking rent rose from $1,376 per unit per month in 2016 to $1,766 in 2025, a 28% increase against CPI's 34%: apartment rents ran slightly behind inflation for the decade, with nearly all of the growth front-loaded (rent reached $1,715 by 2022, then added only 3% over the next three years).
Occupancy ran near 93.4% from 2016 through 2020, tightened to 94.9% in the 2021 demand surge, then declined every year as the supply wave delivered, reaching 91.5% in 2025: roughly 340 basis points below the 2021 peak and the lowest level in the dataset.
The decline is a supply story, not a demand story: absorption stayed positive throughout, and the REIT composite's same-store occupancy held between 95% and 96% every year, full buildings competing against a record lease-up pipeline.
Rent Growth, Occupancy Change, and Market Revenue (2016–2025)
Sources: CoStar multifamily national series; Green Street apartment series, as loaded in the companion workbook (July 2026).
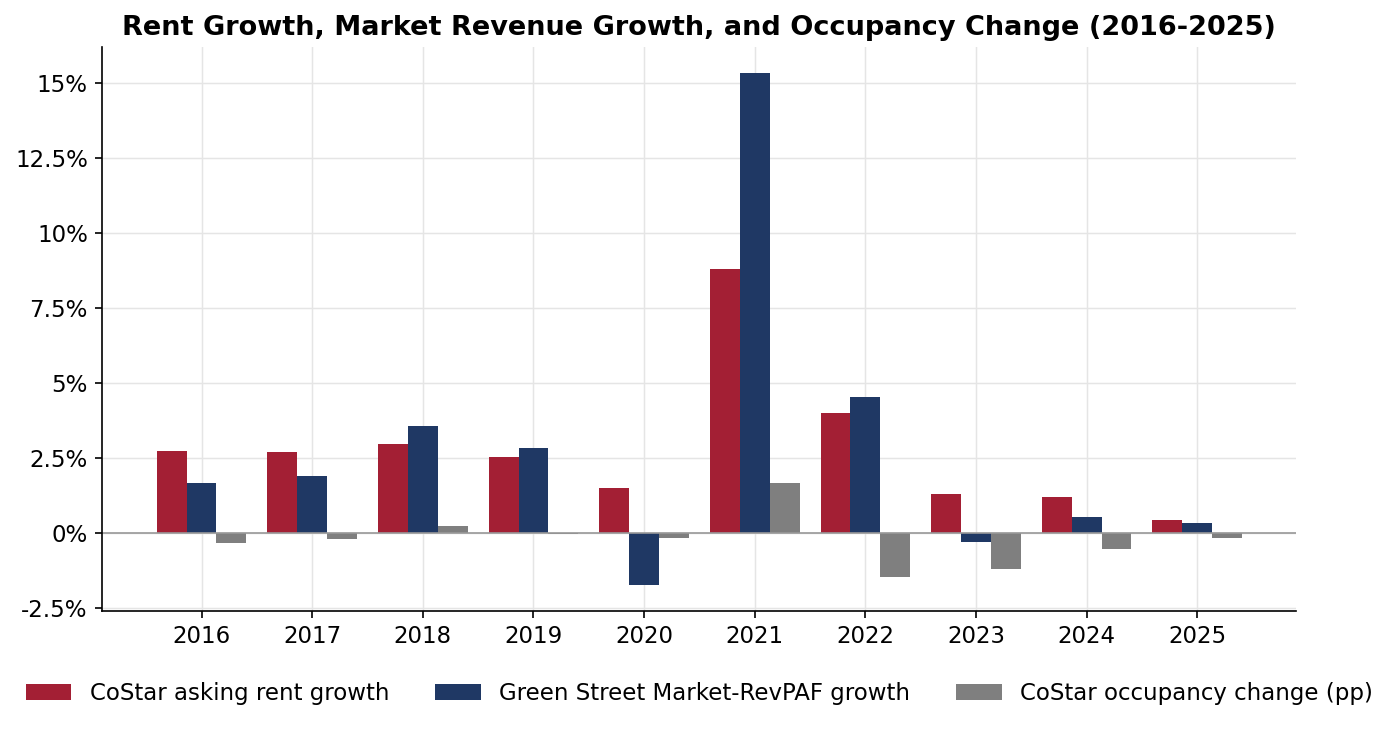
Asking rent growth averaged roughly 2.8% per year from 2016 through 2019, dipped to 1.5% in 2020, spiked to 8.8% in 2021 (the strongest year in the dataset), and has decelerated every year since: 4.0%, 1.3%, 1.2%, and 0.4% in 2025.
Market-RevPAF growth (rent times occupancy) hit +15.3% in 2021, then went roughly flat for three years (-0.3%, +0.5%, +0.3% from 2023 through 2025) as new supply absorbed all of the demand growth.
Contrast with office: multifamily's worst market revenue year was -1.7% (2020) and its flat stretch lasted three years; office posted five consecutive negative years and a 22% cumulative revenue decline over the same window.
Supply Growth, Actual and Forecast (2016–2030)
Source: Green Street apartment series, as loaded in the companion workbook (July 2026). 2026–2030 bars are Green Street forecasts.
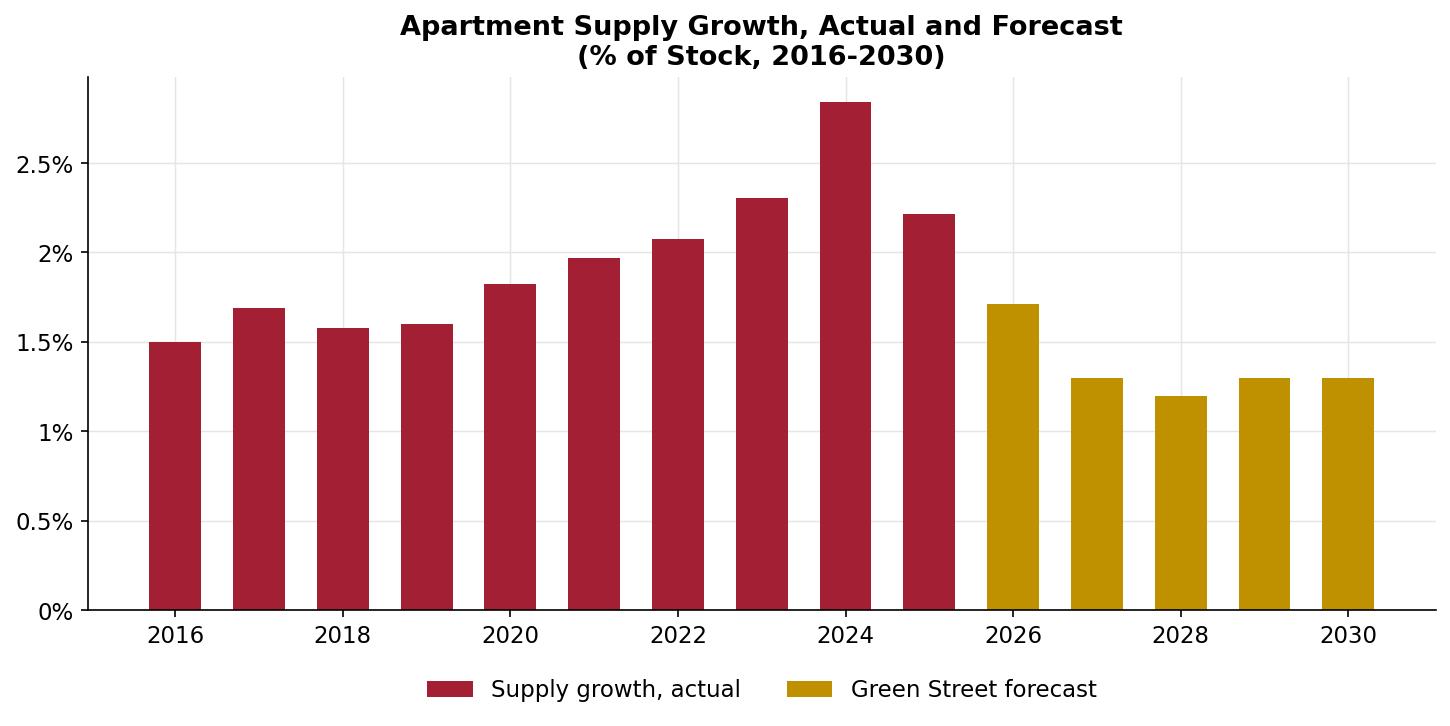
Apartment supply growth ran 1.5 to 1.6% of stock from 2016 through 2019, then climbed every year to a 2024 peak of 2.8% of stock (CoStar's deliveries measure peaked at 3.5% of inventory the same year): the largest apartment construction wave since the 1980s.
The wave is receding fast: 2.2% in 2025, with Green Street forecasting roughly 1.7% in 2026 and 1.2 to 1.3% per year from 2027 through 2030, back below the pre-pandemic pace.
Supply caused this correction: the demand side never broke. That is the mirror image of office, where supply never exceeded 1.6% of stock and the correction was entirely a demand event.
Property Values vs. Construction Costs vs. CPI (2016–2025)
Sources: Green Street apartment CPPI, as loaded in the companion workbook (July 2026); FRED series WPU801 (construction PPI) and CPIAUCSL (CPI). All series indexed to 2016 = 100.
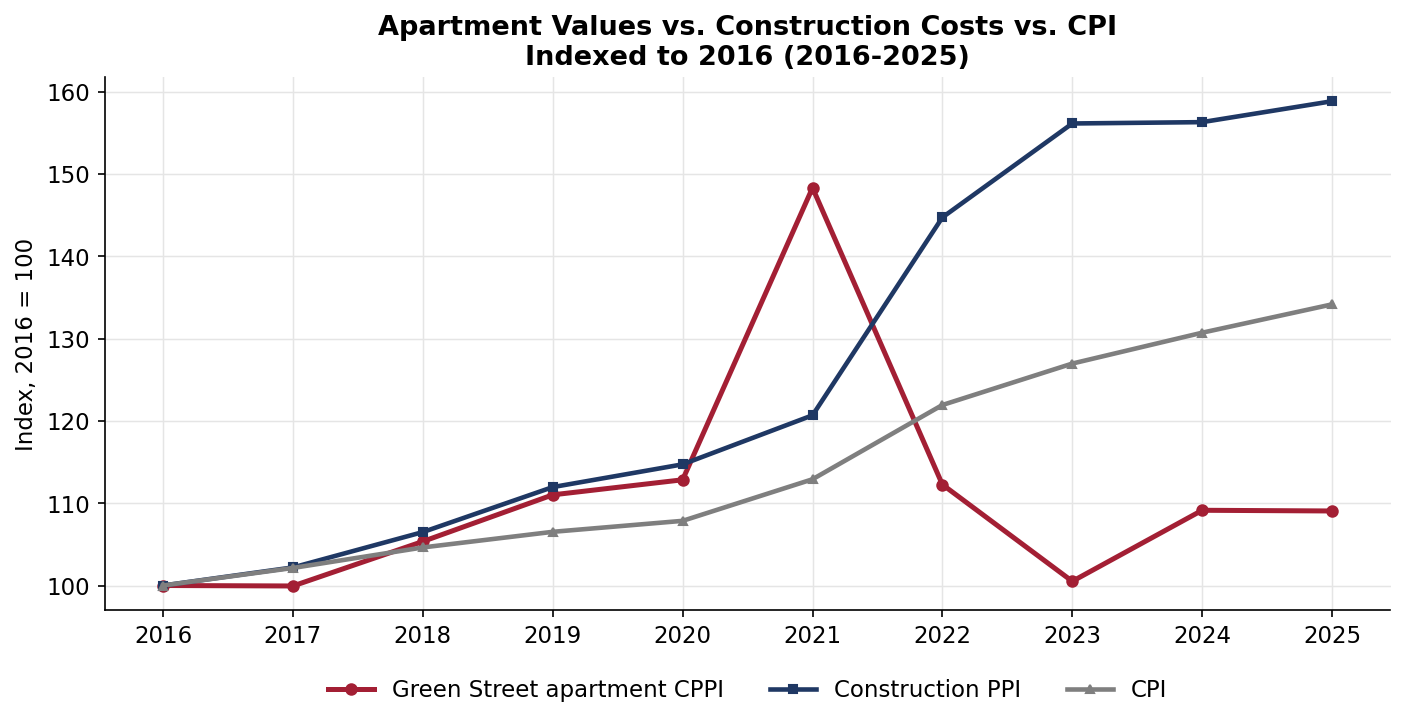
Apartment values rose 48% from 2016 to their 2021 peak (Green Street CPPI: 100 to 148), fell 24% in 2022 and a further 11% in 2023 (to 100.5, erasing the entire boom), and have recovered modestly to 109, where they have held since 2024: down 26% from peak, up 9% for the decade.
Construction costs rose 59% and CPI 34% over the same window: apartment values at 109 against construction costs at 159 (both 2016 = 100) mean most existing apartments trade below replacement cost, which is precisely the arithmetic now shutting down new construction starts.
The below-replacement gap is real but far narrower than office (values at 44 against the same 159 cost index): apartments repriced on rates and supply, not on a demand regime change.
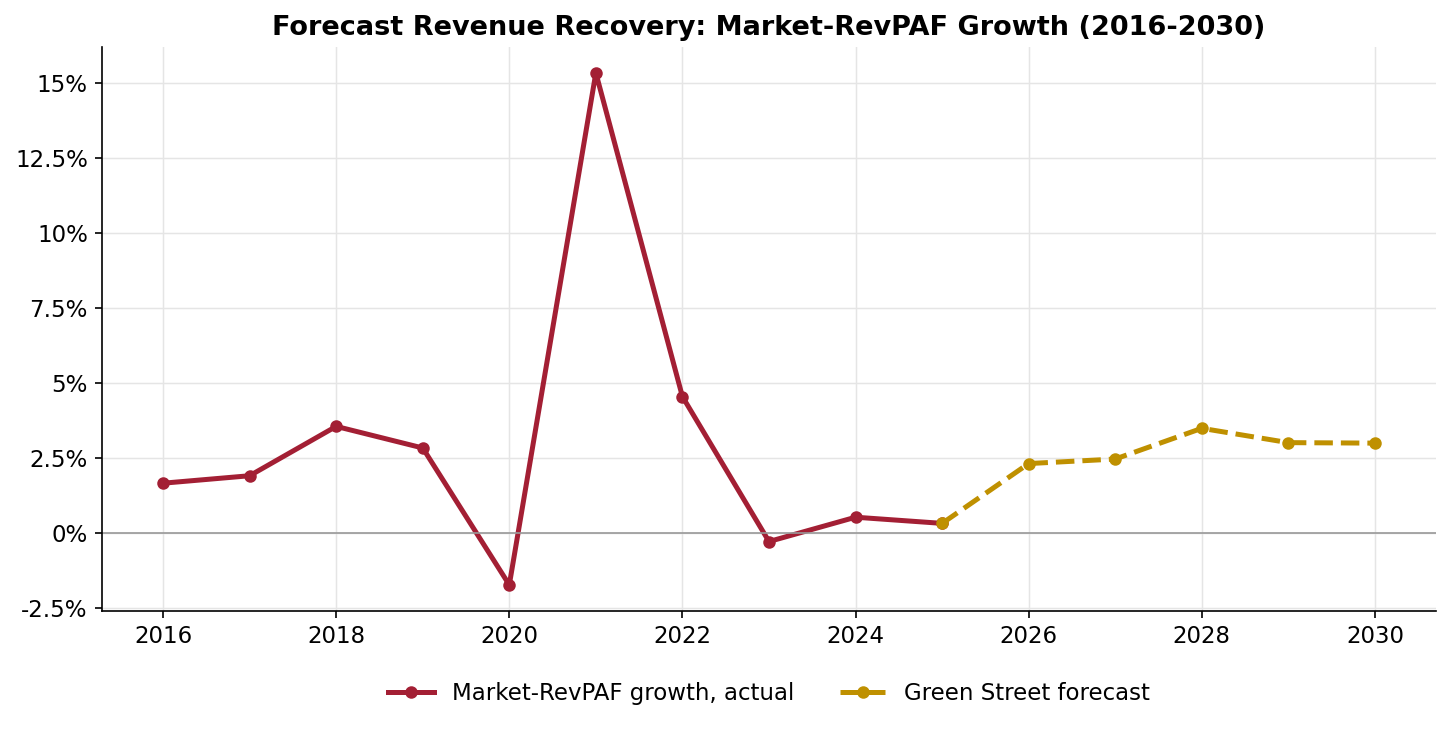
Source: Green Street apartment series, as loaded in the companion workbook (July 2026). Dashed segment (2026–2030) is the Green Street forecast.
Green Street forecasts apartment Market-RevPAF growth of +2.3% in 2026, +2.5% in 2027, and roughly +3.0 to +3.5% per year from 2028 through 2030.
The recovery mechanism is supply: with deliveries falling toward 1.2% of stock and household demand intact, even steady absorption re-tightens the market. This is a faster and more conventional recovery path than office, where the same supply mechanism must offset a structural demand loss.
The forecast follows three flat years, not a collapse: market revenue never fell more than 1.7% in any year of the window, so the recovery starts from a high base.
Notes
CoStar and Green Street series are proprietary, licensed via MIT CRE, and carried in the companion workbook's market tabs with source documentation on its Sources tab. Occupancy is 100 minus CoStar national multifamily vacancy. Market-RevPAF is Green Street's revenue per available foot measure (rent times occupancy), 50-market weighted average for the apartment sector. Rent figures are per unit per month.
Companion workbook.multifamily-reit-metrics.xlsx – CRE42 multifamily REIT composite annual model (FY2016–FY2025), per-REIT and vs-market tabs, and market comparison data.