
Multifamily REIT Metrics & Current Cycle, 2016–2025
Multifamily Real Estate 10-Year Cycle: Highlights and Summary
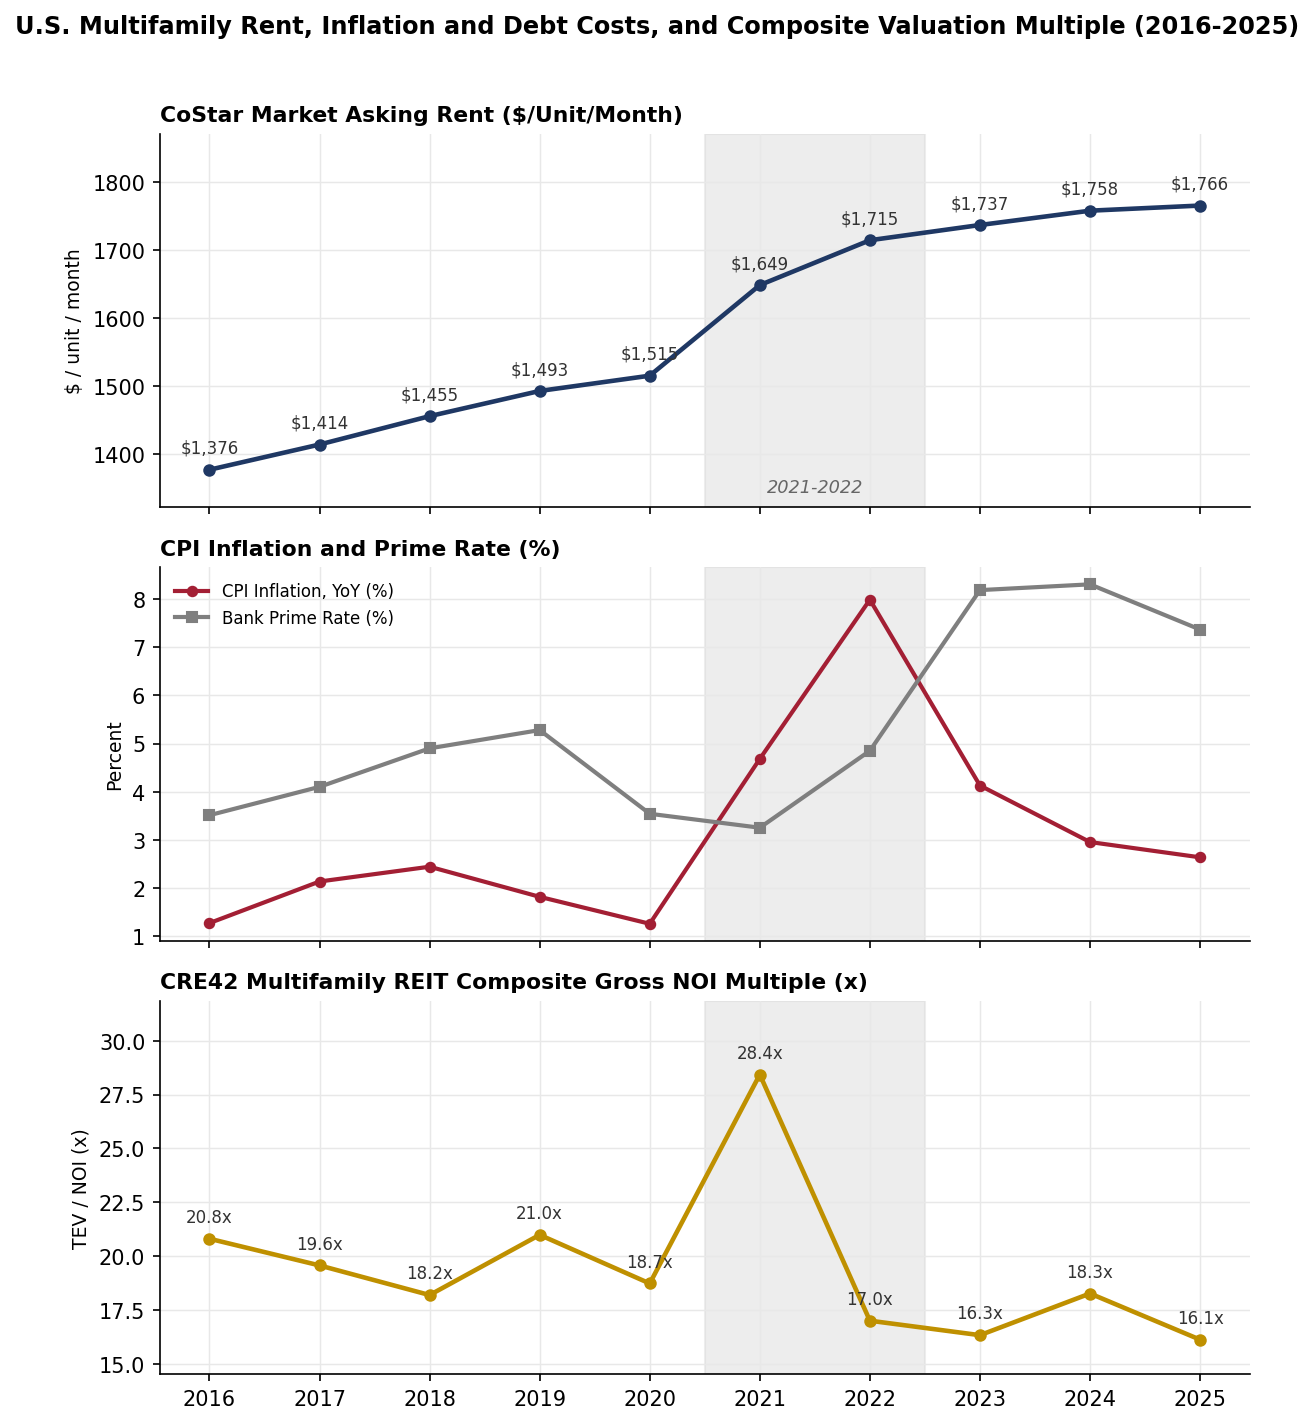
Sources: CoStar multifamily national series (rent); FRED series CPIAUCSL and MPRIME (inflation, prime rate); CRE42 multifamily REIT composite (component filings), CRE42-derived multiple.
US multifamily entered 2016 as a steady performer: national occupancy near 93%, asking rents rising 2 to 3% a year, and supply growth under 2% of stock, leading to steady NOI growth and values through 2019. Following a brief pandemic dip, near-zero rates and strong revenue growth lifted the composite gross NOI multiple from 18.7x to 28.4x; in 2022, CPI inflation rose past 8% and the prime rate climbed from 3.3% toward 8.3%. At the same time, a record construction wave led to near-zero rent growth for the next three years while national vacancy rose to 8.5%. In 2025 the supply wave began to recede: deliveries fell by a quarter from their 2024 peak, and Green Street forecasts supply growth near 1.3% of stock by 2027 with market revenue growth recovering to roughly 3% a year.
CRE42 uses a three-REIT composite (AvalonBay, Mid-America, Camden) to illustrate the last decade in US multifamily; its construction is detailed on the CRE42 Multifamily REIT Composite page, and composite figures are referenced throughout this cluster.
Cycle Inflection Point: 2021–2022
The highlighted band in the chart above isolates 2021 to 2022. The composite multiple ran from 18.7x in 2020 to 28.4x in 2021, compressing the composite implied cap rate to 3.52%. Green Street's apartment CPPI [1] rose 31% in a single year. The 2022 rate shock reversed all of it in one year: multiple to 17.0x, implied cap rate to 5.88%, values down 24%. Since 2022 the multiple has drifted between 16x and 18x.
Debt Metrics Overpower Operating Metrics Part I: NOI (Unlevered)
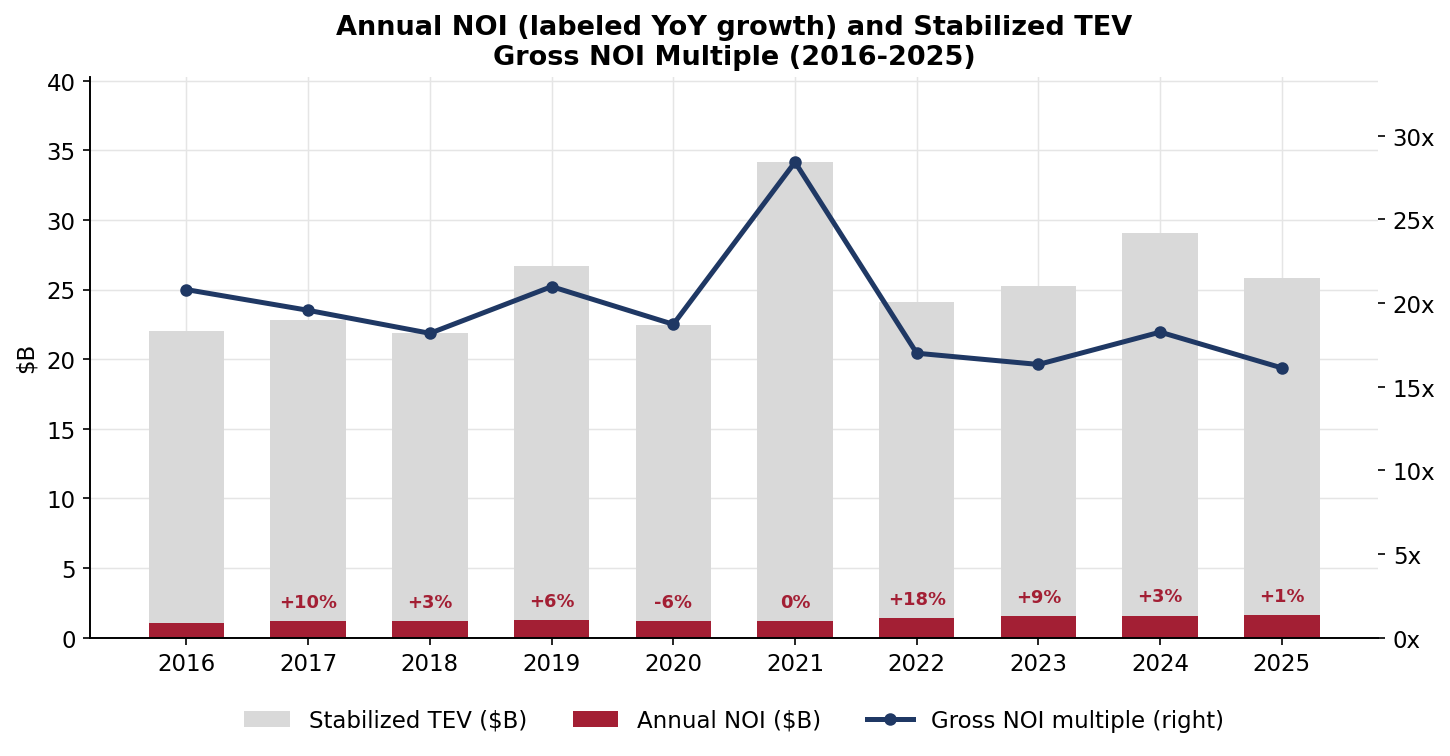
Source: CRE42 multifamily REIT composite (component filings); CRE42-derived measures. Composite figures on a single-REIT-equivalent (TEV-weighted) basis.
Debt Metrics Overpower Operating Metrics Part II: Leveraged CF
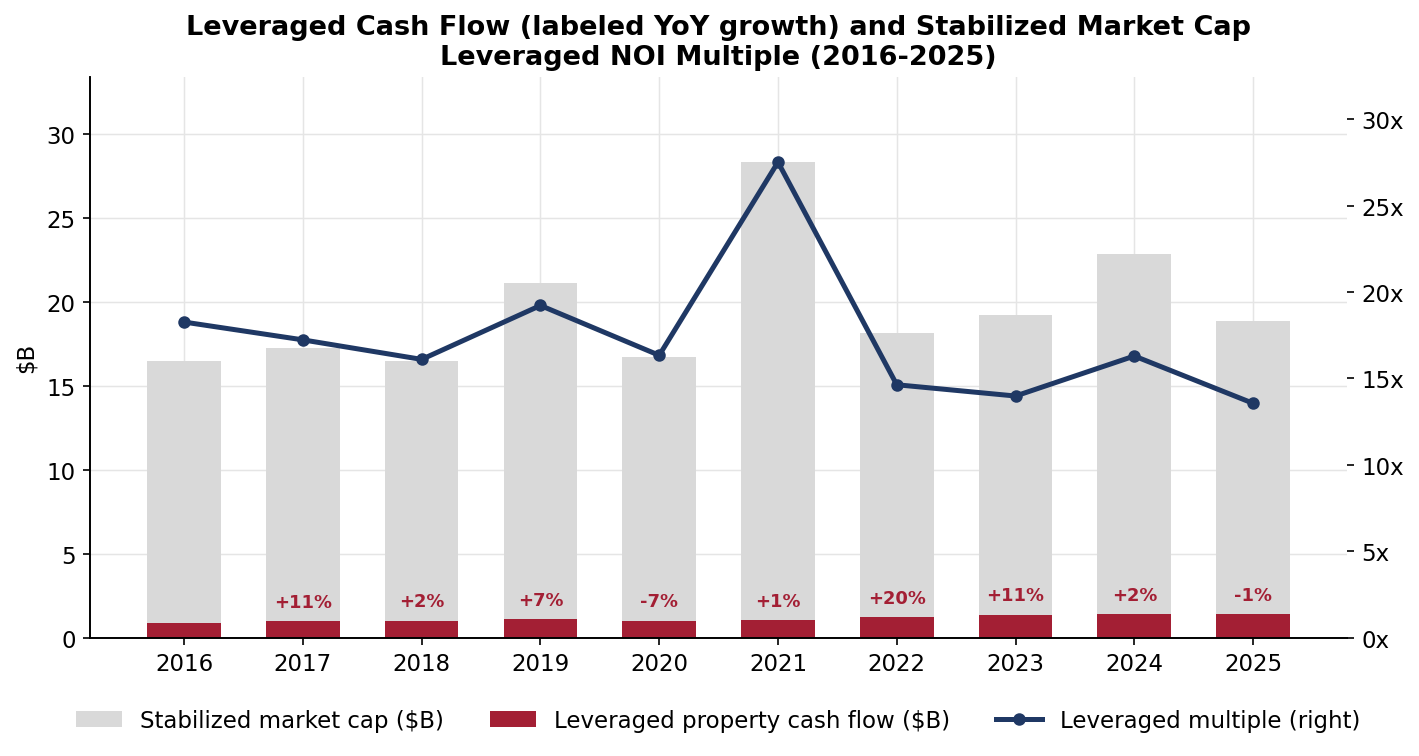
Source: CRE42 multifamily REIT composite (component filings); CRE42-derived measures. Composite figures on a single-REIT-equivalent (TEV-weighted) basis.
Notes
[1] Green Street's Commercial Property Price Index (CPPI) tracks the prices at which institutional-quality US commercial properties trade. Green Street estimates it from observed transactions and its market cap-rate and NOI series rather than from appraisals, so it moves earlier than appraisal-based indices. The apartment CPPI used here is the sector series, fourth-quarter values, rebased to 2016 = 100. ↩
Composite figures are a stabilized-TEV-weighted blend of AvalonBay, Mid-America, and Camden, constructed to read like a single large apartment REIT; see the CRE42 Multifamily REIT Composite page and the companion model workbook for methodology and per-component basis notes. Gross NOI multiple = stabilized total enterprise value / annual NOI; leveraged multiple = stabilized equity market cap / leveraged property cash flow. All dollar figures are aggregate composite, not per share.
Companion workbook. multifamily-reit-metrics.xlsx – CRE42 multifamily REIT composite annual model (FY2016–FY2025), per-REIT and vs-market tabs, and market comparison data.