Composite Implied Cap Rate vs. 10-Yr UST (2016–2025)
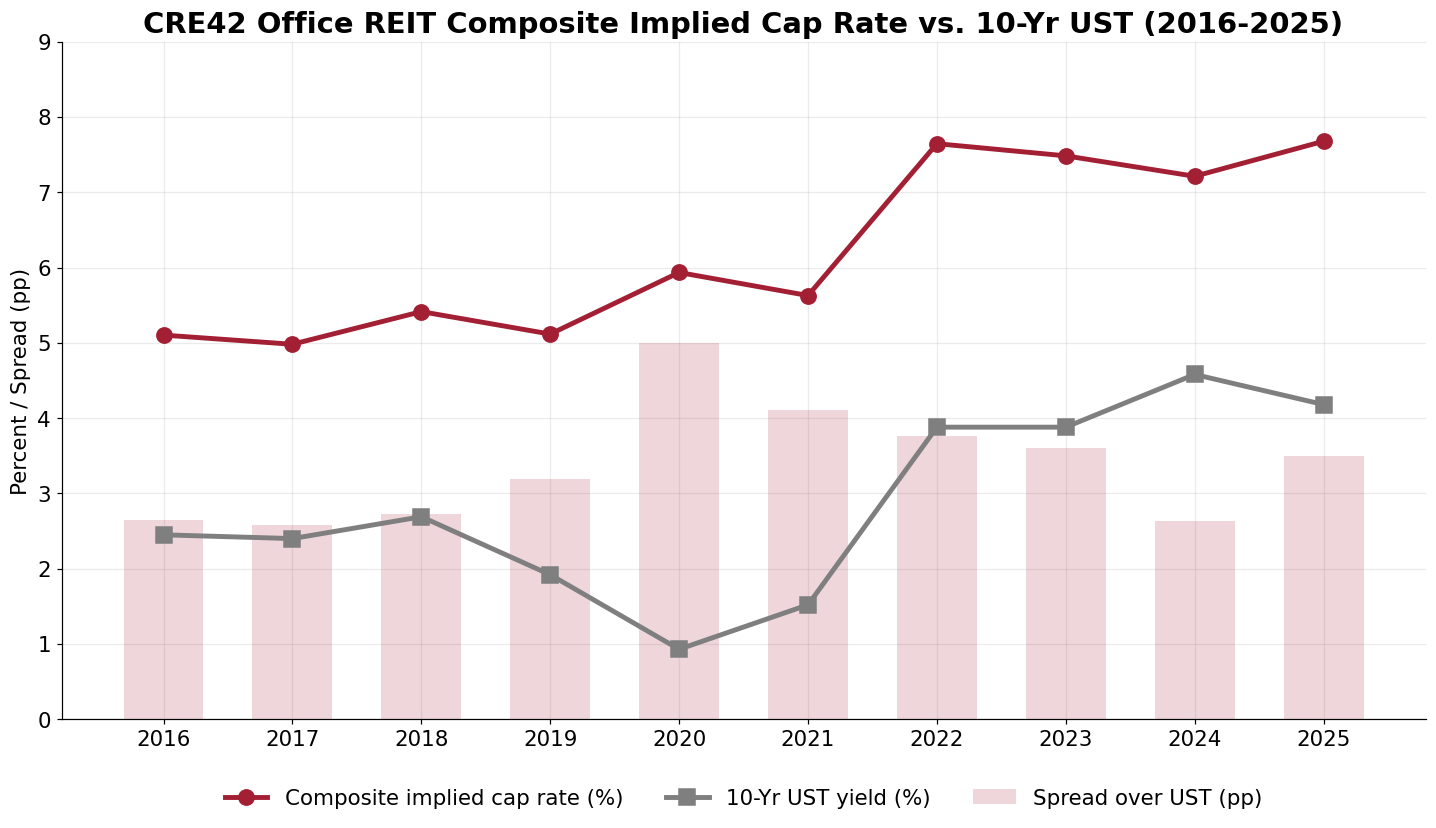
Sources: CRE42 office REIT composite (component filings; CRE42-derived implied cap rate); FRED series DGS10, year-end.
The composite implied cap rate rose from 5.10% in 2016 to 7.68% in 2025, with the full reset concentrated in 2022 (5.63% to 7.65%). There was no sustained cap-rate compression phase in this cycle: office pricing was already drifting wider before 2022.
The spread over Treasuries widened from 2.7 pp in 2016 to 3.5 pp in 2025, peaking at 5.0 pp in 2020 when the 10-year UST hit 0.93%.
Office cap rates have decoupled from the UST cycle: the 10-year fell from 4.58% at year-end 2024 to 4.18% at year-end 2025, while the office composite cap rate rose from 7.21% to 7.68%.
Composite Cap Rate vs. Leveraged Equity Yield (2016–2025)
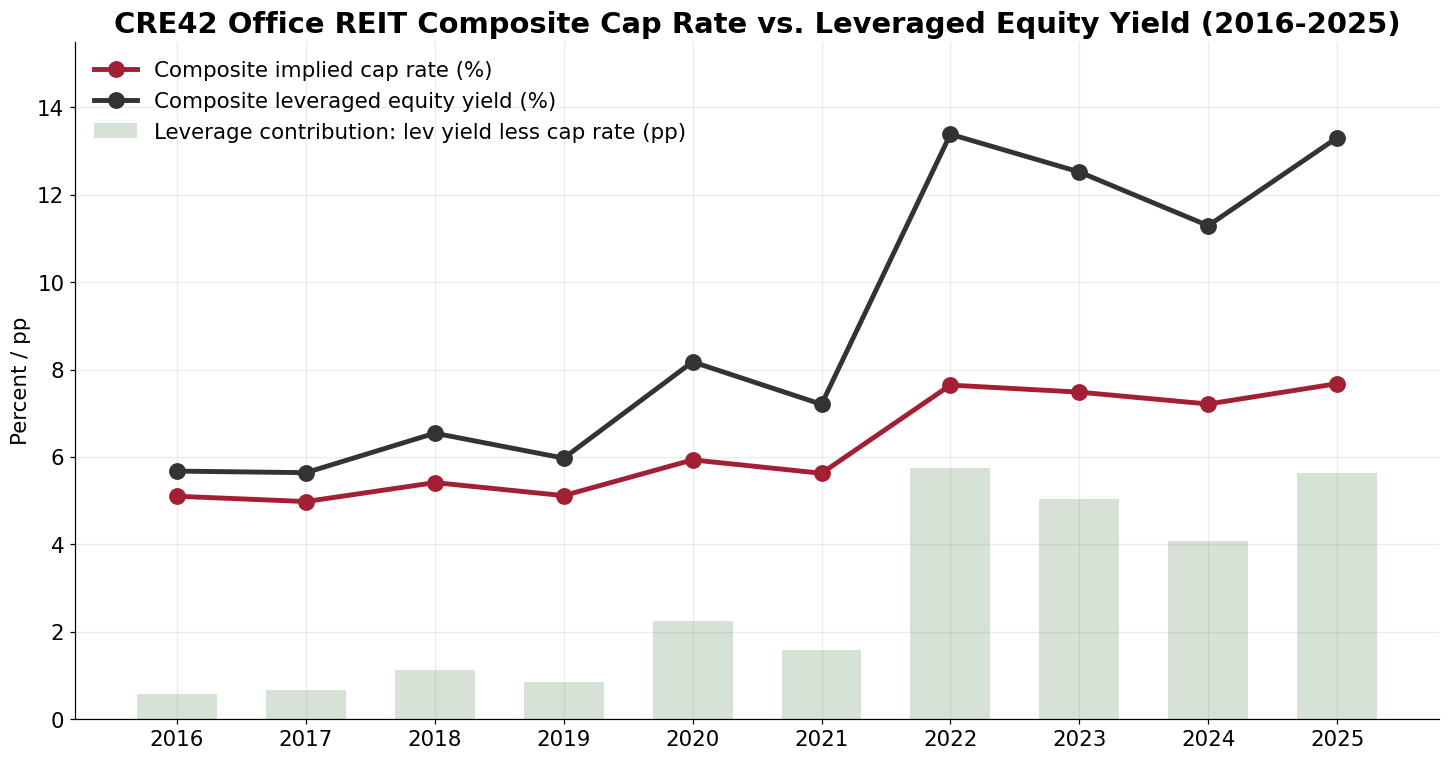
The composite leveraged equity yield rose from 5.7% in 2016 to 13.3% in 2025, more than doubling; the largest one-year move was 2022 (7.2% to 13.4%).
Leverage contribution (equity yield less cap rate) expanded from 0.6 pp in 2016 to 5.6 pp in 2025: in-place debt, much of it fixed at pre-2022 coupons, is strongly accretive at current pricing.
A 13.3% leveraged yield on stabilized office cash flow is the market's price for occupancy and refinancing risk, not surplus return: the composite's stabilized market cap has fallen 46% since 2021 while its cash flow was flat.
Public vs. Private Office Cap Rates (2016–2025)
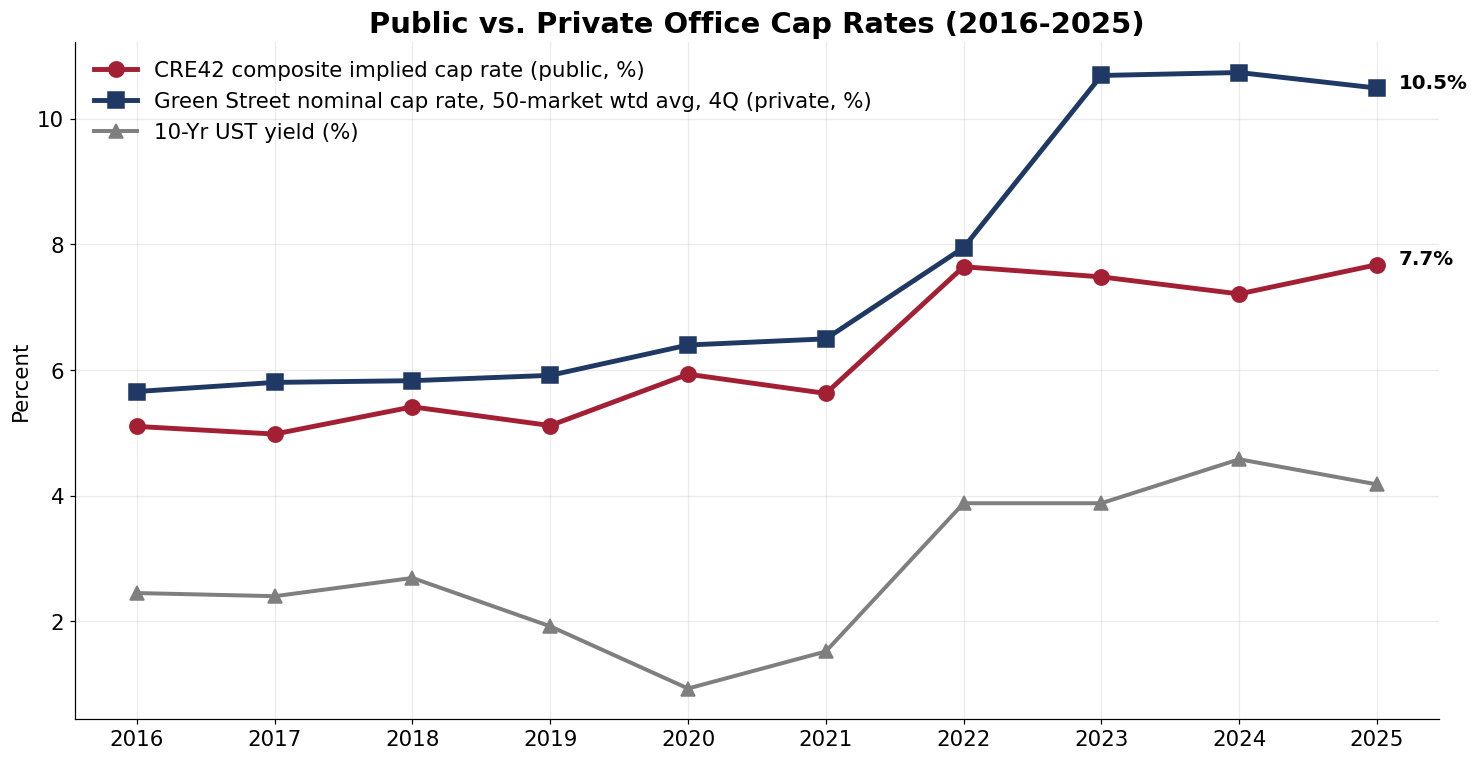
Sources: CRE42 office REIT composite (public); Green Street office nominal cap rate, market-weighted average, 4Q values, as loaded in the companion workbook (verified July 2026).
The public composite (7.68% in 2025) prices roughly 280 bp inside the Green Street private-market average (10.49%).
Public pricing moved first and fastest (5.6% to 7.7% during 2022), while the private average took until 2023 to reach 10.7% and has plateaued since.
Composition explains much of the level gap: the composite holds Class A gateway CBD and Sun Belt best-business-district portfolios running 86–91% occupancy, while the market-weighted private average includes the commodity stock carrying the worst of the vacancy. The REIT market prices the quality tier, not the average office building.
Notes
Composite figures are a stabilized-TEV-weighted blend of BXP, Cousins Properties, and Highwoods Properties; see the CRE42 Office REIT Composite page and the companion workbook for methodology. Implied cap rate = composite annual NOI / stabilized TEV; leveraged equity yield = leveraged property cash flow / stabilized market cap. Green Street cap rates are proprietary, licensed via MIT CRE.
Companion workbook.office-reit-metrics.xlsx – CRE42 office REIT composite annual model (FY2016–FY2025), per-REIT and vs-market tabs, and market comparison data.