
Office REIT Metrics & Current Cycle, 2016–2025
Office Real Estate 10-Year Cycle: Highlights and Summary
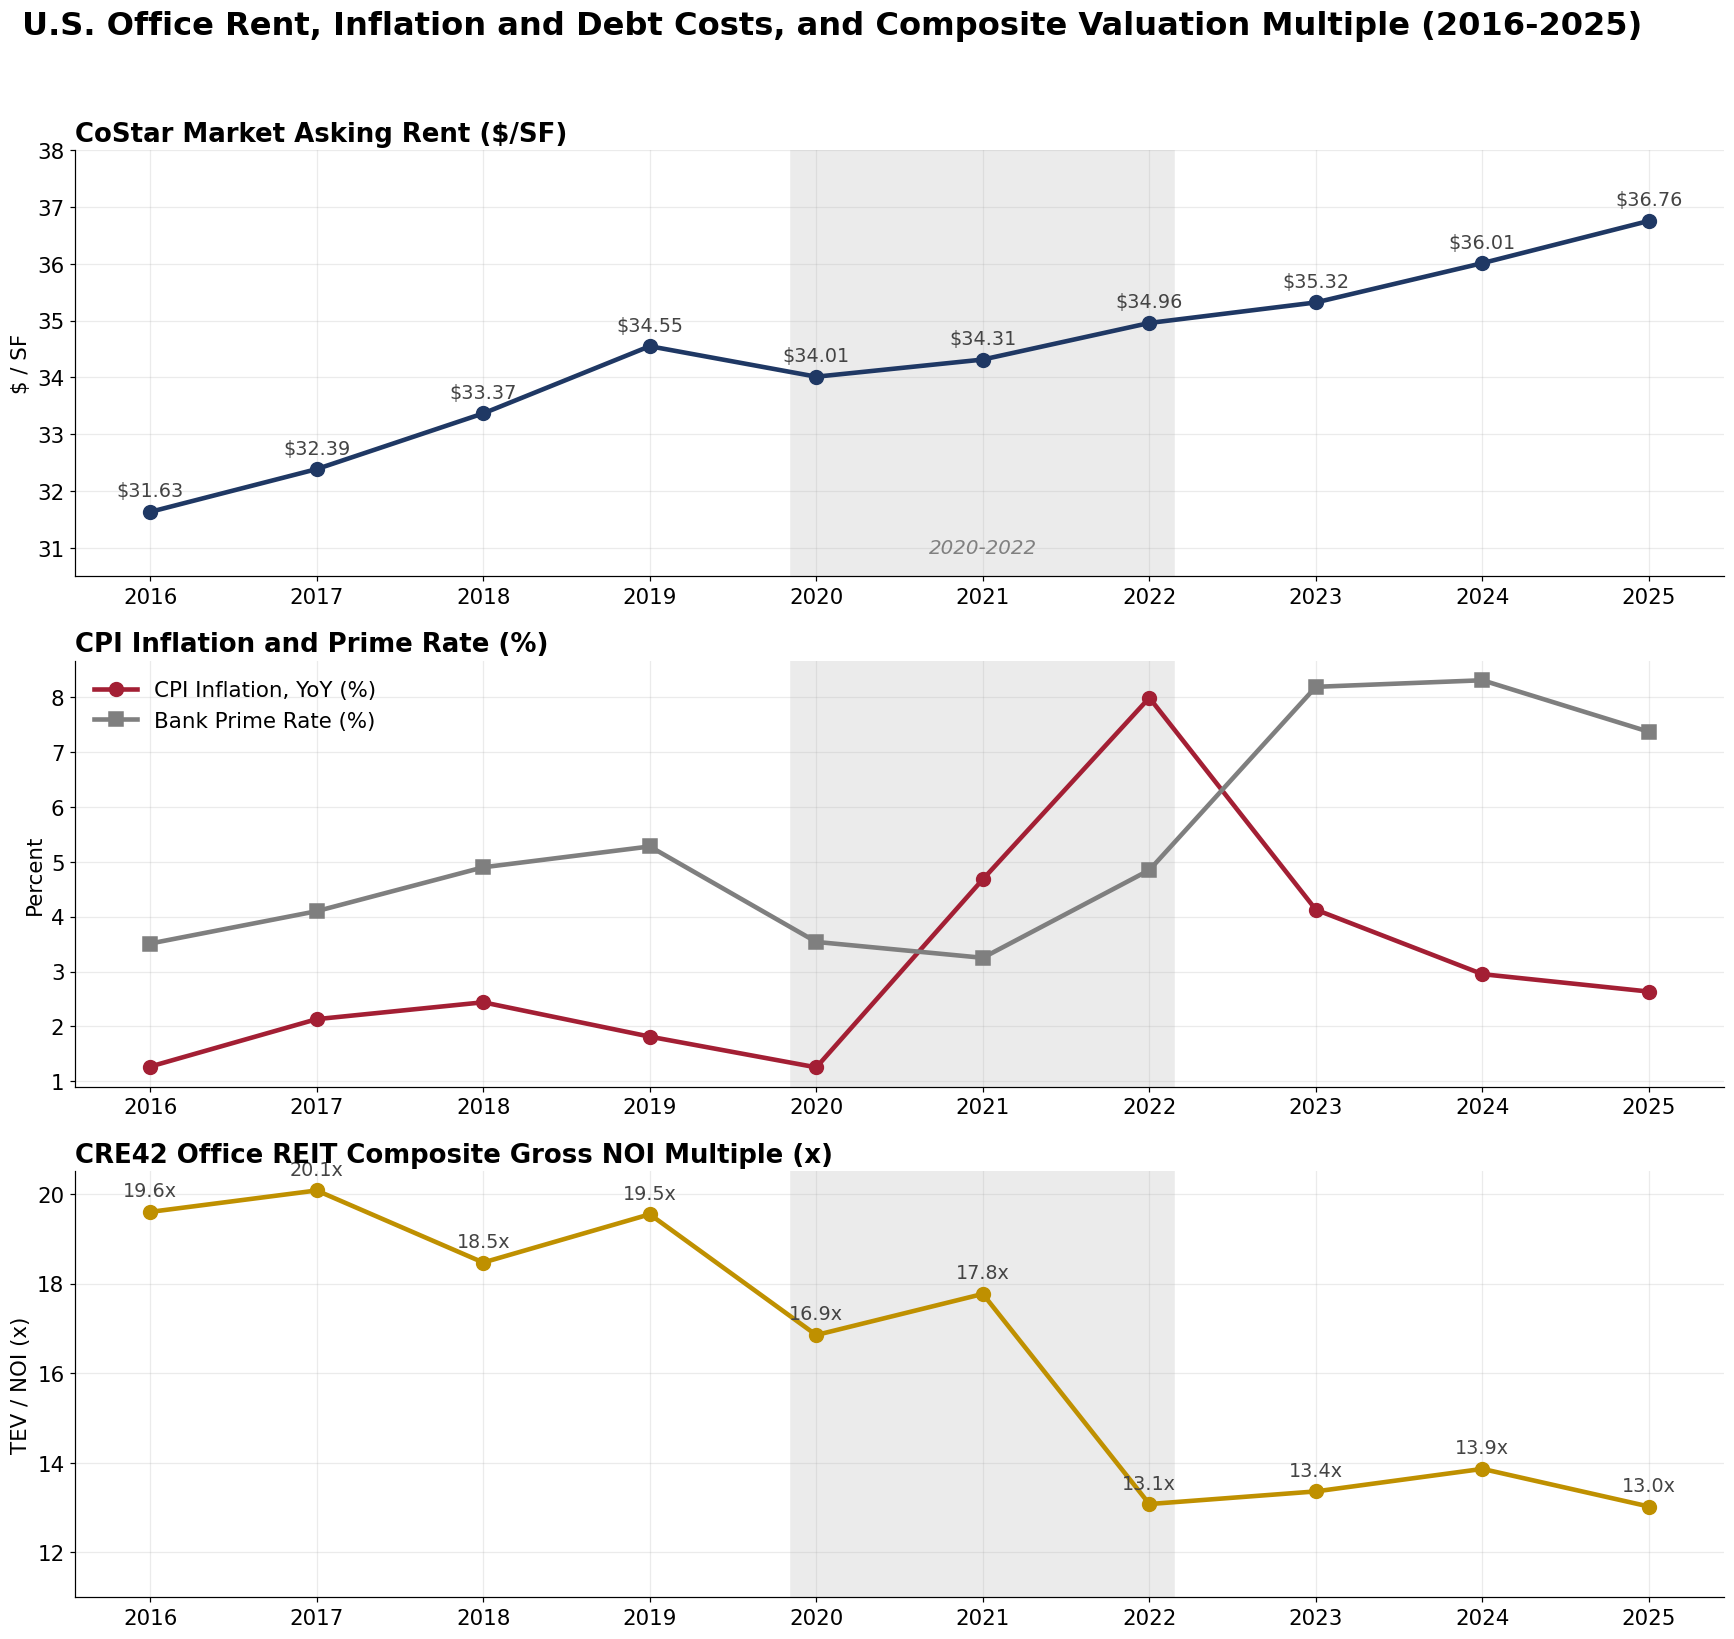
Sources: CoStar office national series (rent); FRED series CPIAUCSL and MPRIME (inflation, prime rate); CRE42 office REIT composite (component filings), CRE42-derived multiple.
U.S. office entered 2016 as a stable, fully recovered sector: national occupancy above 90%, asking rents rising 2 to 3% a year, and modest new supply. The decade's first break came in 2020, when remote and hybrid work cut office utilization; national occupancy began a decline that had not reversed by 2025 (90.3% in 2016 to 86.0% in 2025, CoStar). The second break was the 2022 inflation spike and the interest rate shock that followed, repricing office alongside every long-duration asset. Office demand itself contracted: market revenue (Green Street Market-RevPAF) fell five consecutive years from 2020 through 2024, and new construction fell toward zero. To read these movements through public-market data, CRE42 builds a three-REIT composite (BXP, Cousins, Highwoods) whose construction is detailed on the CRE42 Office REIT Composite page; composite figures are referenced throughout this cluster. In 2025 the first stabilization signals appeared: occupancy held flat for the first year since 2019, Market-RevPAF growth turned marginally positive, and Green Street forecasts a slow supply-led recovery from 2026.
Cycle Inflection Point: 2020–2022
The highlighted box in the chart above isolates 2020 to 2022. Office never had a Covid-era valuation boom: the composite gross NOI multiple slipped to 16.9x in 2020 as occupancy fell, recovered only to 17.8x in 2021 on near-zero rates, then broke to 13.1x in 2022 when CPI inflation reached 8% and the prime rate began its climb from 3.3% toward 8.3%. There was no upward re-rating to give back; the 2022 break took the multiple straight below its pre-pandemic range. The composite implied cap rate moved from 5.6% (2021) to 7.6% (2022) and has stayed near that level since.
Debt Metrics Overpower Operating Metrics Part I: NOI (Unlevered)
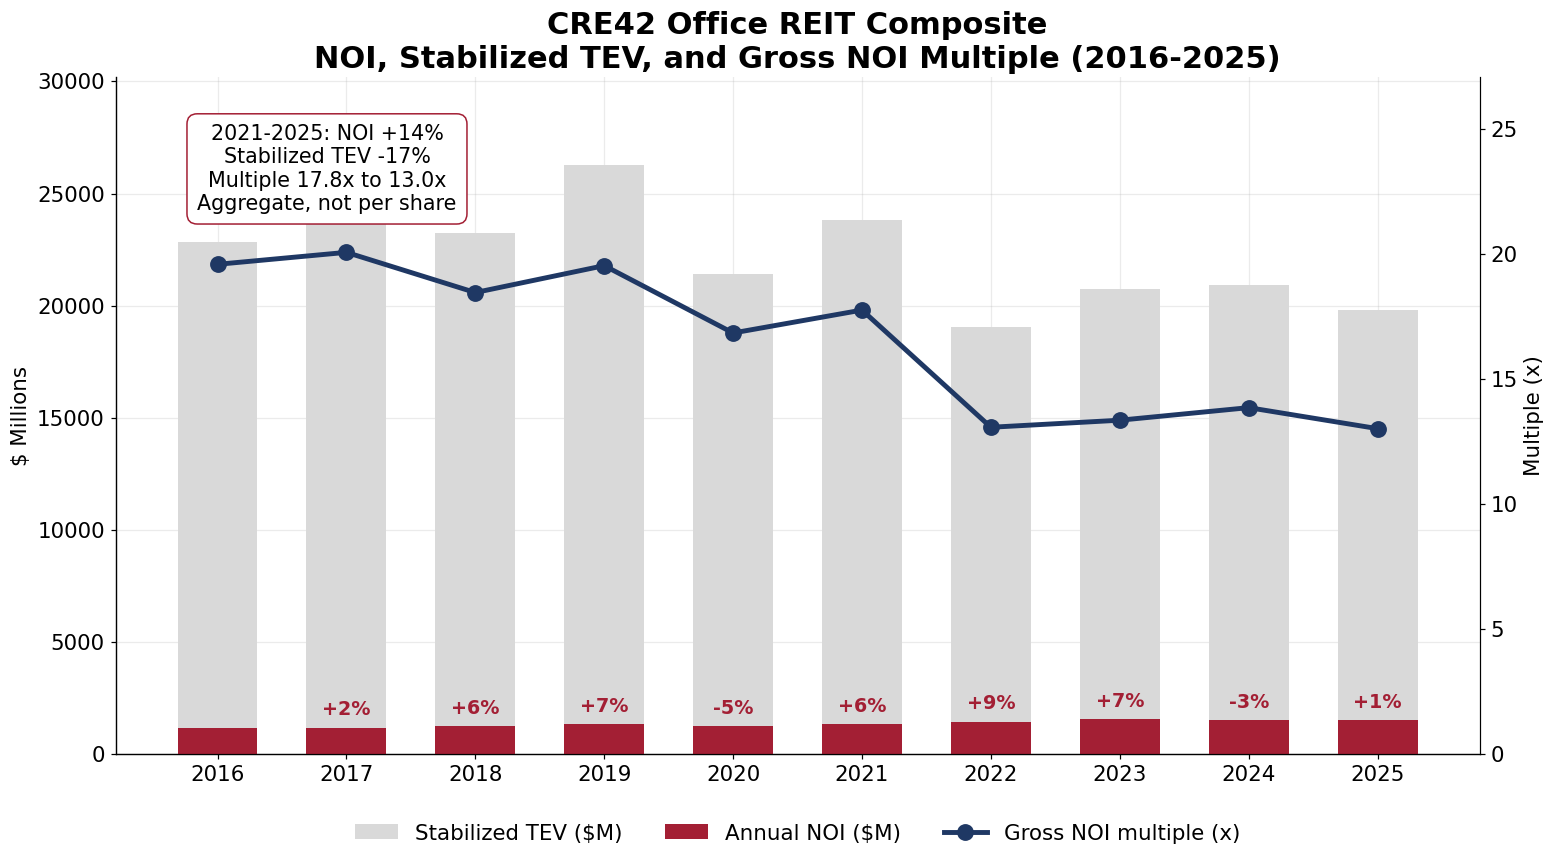
Source: CRE42 office REIT composite (component filings); CRE42-derived measures. Composite figures on a single-REIT-equivalent (TEV-weighted) basis.
Debt Metrics Overpower Operating Metrics Part II: Leveraged CF
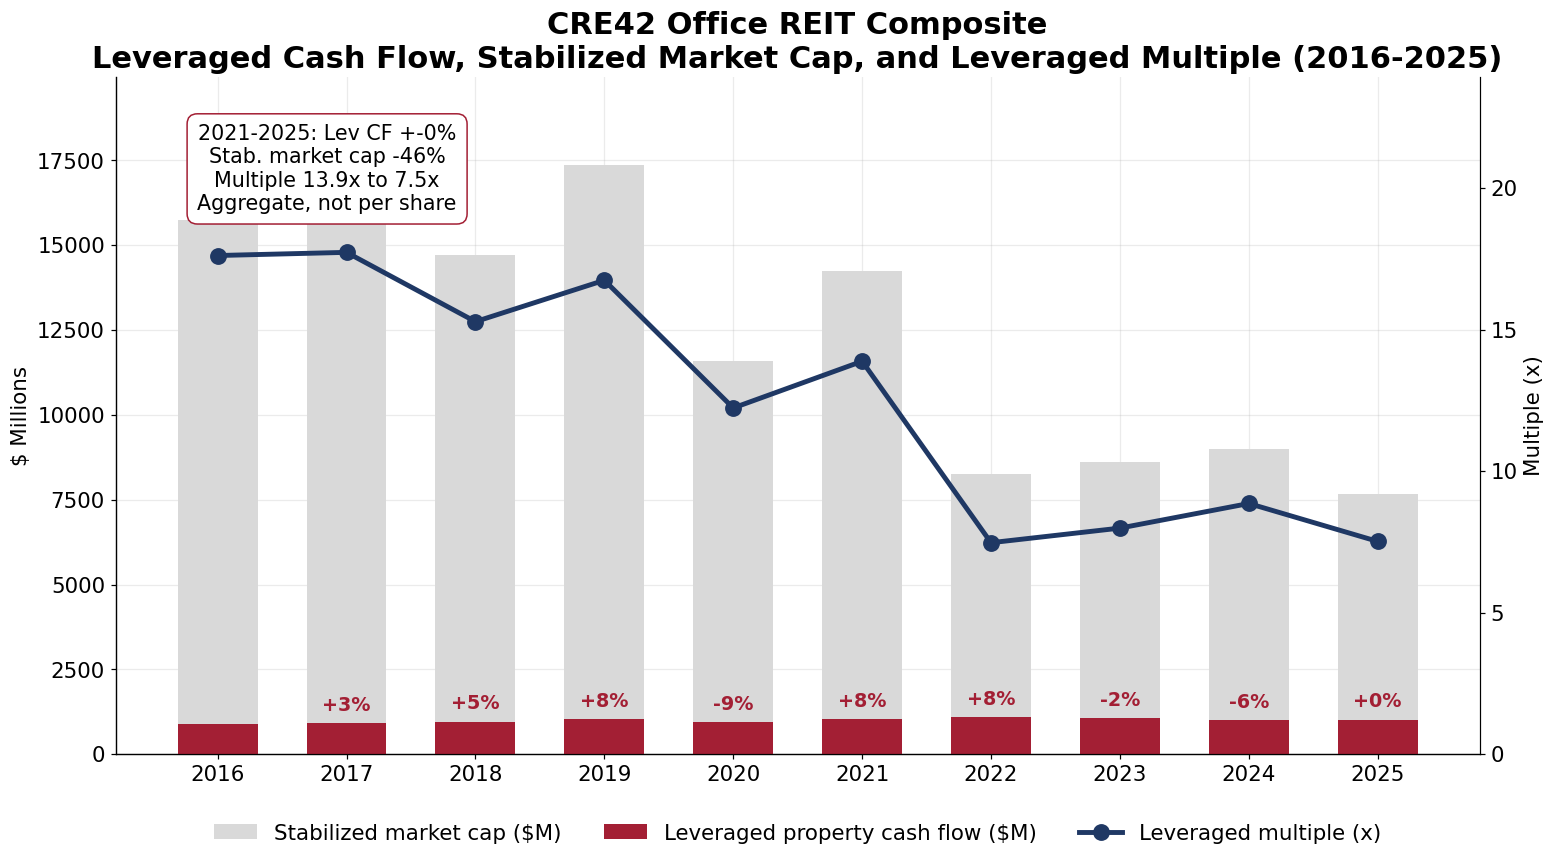
Source: CRE42 office REIT composite (component filings); CRE42-derived measures. Composite figures on a single-REIT-equivalent (TEV-weighted) basis.
Notes
Composite figures are a stabilized-TEV-weighted blend of BXP, Cousins Properties, and Highwoods Properties, constructed to read like a single large office REIT; see the CRE42 Office REIT Composite page and the companion model workbook for methodology and per-component basis notes. Gross NOI multiple = stabilized total enterprise value / annual NOI; leveraged multiple = stabilized equity market cap / leveraged property cash flow. All dollar figures are aggregate composite, not per share.
Companion workbook. office-reit-metrics.xlsx – CRE42 office REIT composite annual model (FY2016–FY2025), per-REIT and vs-market tabs, and market comparison data.