
AI-Attributed Layoffs
AI was the leading cited reason for U.S. announced job cuts for five straight months, March through July 2026, peaking at 40% of May’s cuts; in August the share fell to 6.5%.
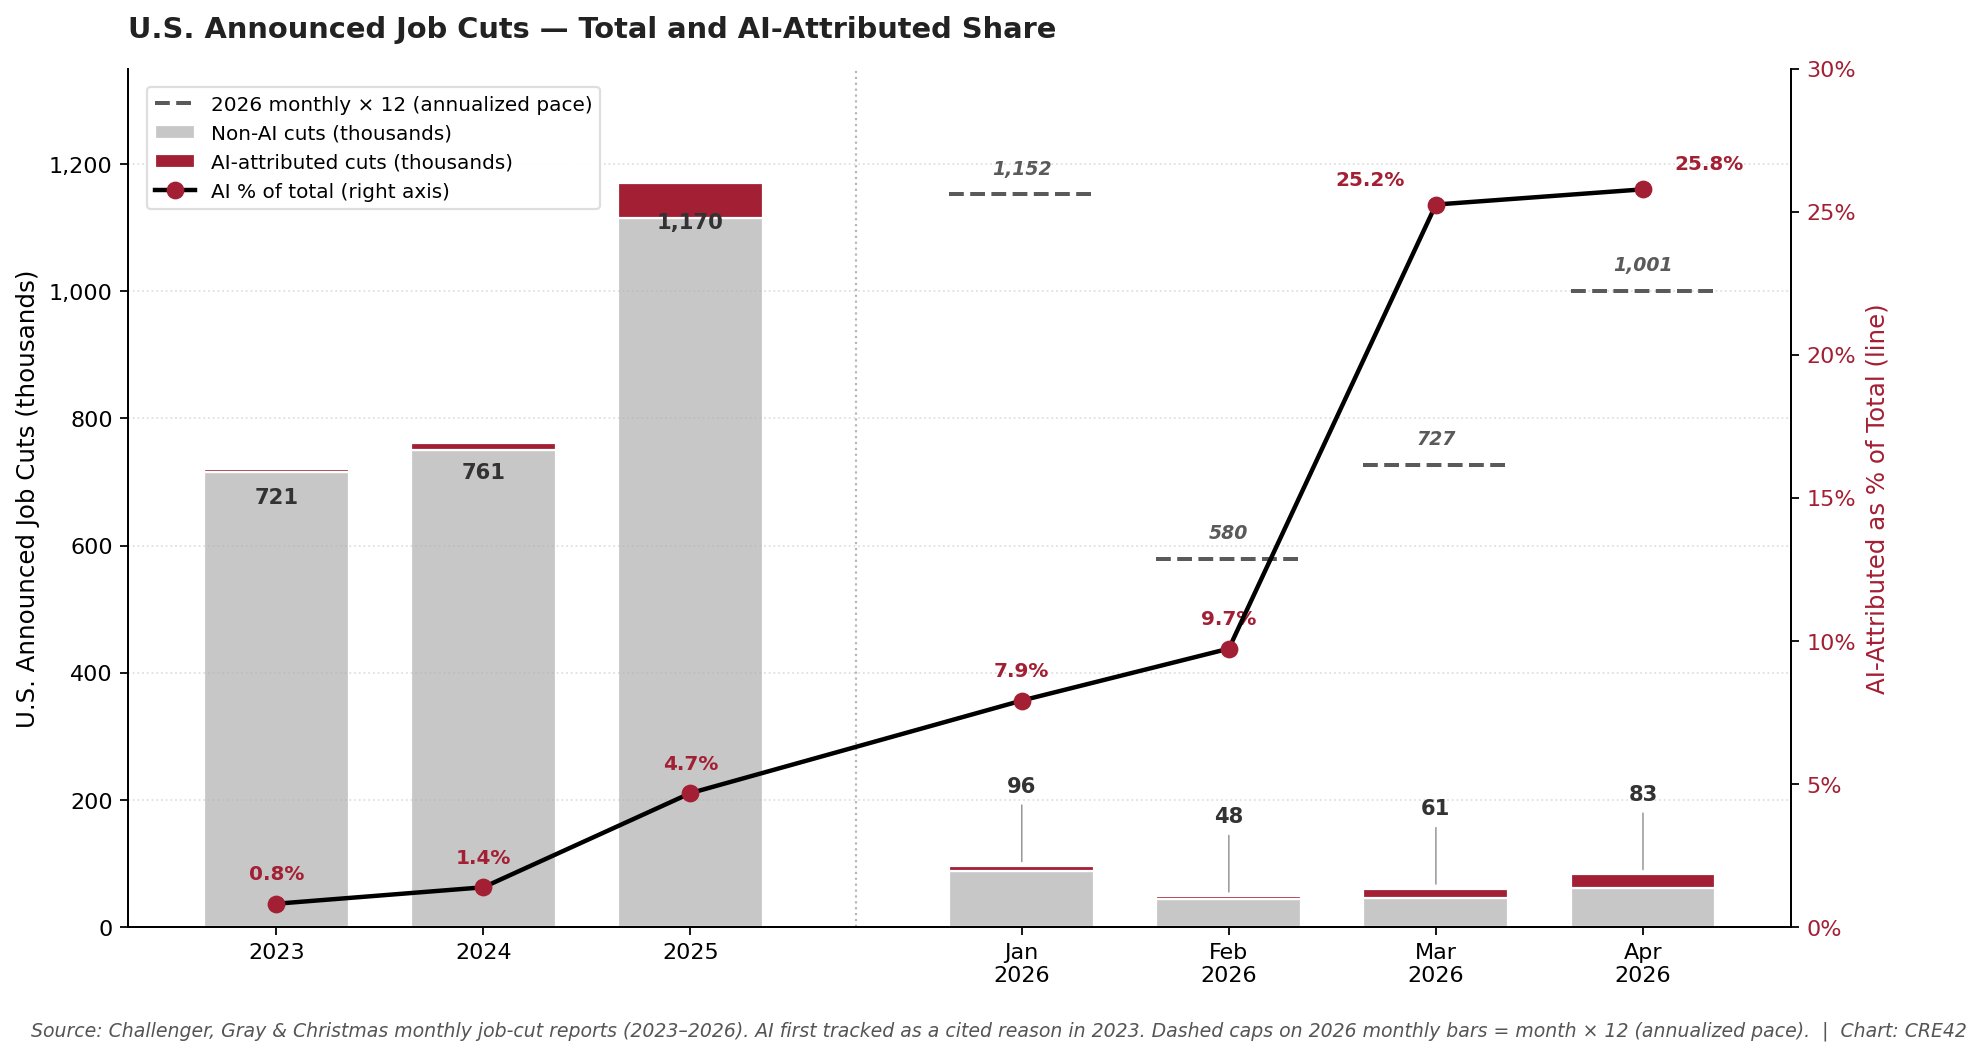
U.S. Announced Job Cuts: Total and AI-Attributed Share | Source: Challenger, Gray & Christmas monthly job-cut reports and year-end PDFs (2023 through August 2026).
AI-attributed layoffs rose from 0.6% of total announced cuts in 2023 to about 25% in March and April 2026 and a record 39.8% in May (38,579 cuts), held near a third in June and July, then fell to 6.5% in August (3,462 cuts), the lowest monthly total since December 2025.[1] Through August, AI has been cited for 116,175 cuts, 21.9% of the 2026 total and still the leading reason for the year, more than double the 54,836 attributed to AI in all of 2025.
Overall 2026 layoffs through August (529,914) are down 41% from the same period in 2025, but the comparison is distorted by federal DOGE cuts that defined Q1 2025.[2] Excluding government, layoffs are running about 15% below 2025, and August’s 52,881 was the lowest August total since 2022.
Technology has accounted for 29% of all 2026 announced cuts through August (155,126 of 529,914), up 52% from the same period of 2025 and more than double the sector's 13% share of the 2025 total; August’s 6,103 technology cuts were the sector’s lowest month of the year.[3]
Challenger's "AI" category aggregates three distinct causes: actual AI role replacement, AI capex spending crowding out personnel budgets, and "AI washing" of layoffs done for other reasons. The drop in AI attributions since May may also reflect two forces outside the layoffs themselves: public sentiment toward AI has turned more negative in the current political moment, and "AI washing" has drawn pushback, so companies have less reason to name AI in an announcement. See Detailed context and analysis below.
Quantifying the Effect of AI on Jobs: Early Returns
Since January 2022, total U.S. employment has grown 6.0% while the three pure knowledge-work sectors have grown 0.7% combined, and Information employment has declined outright.
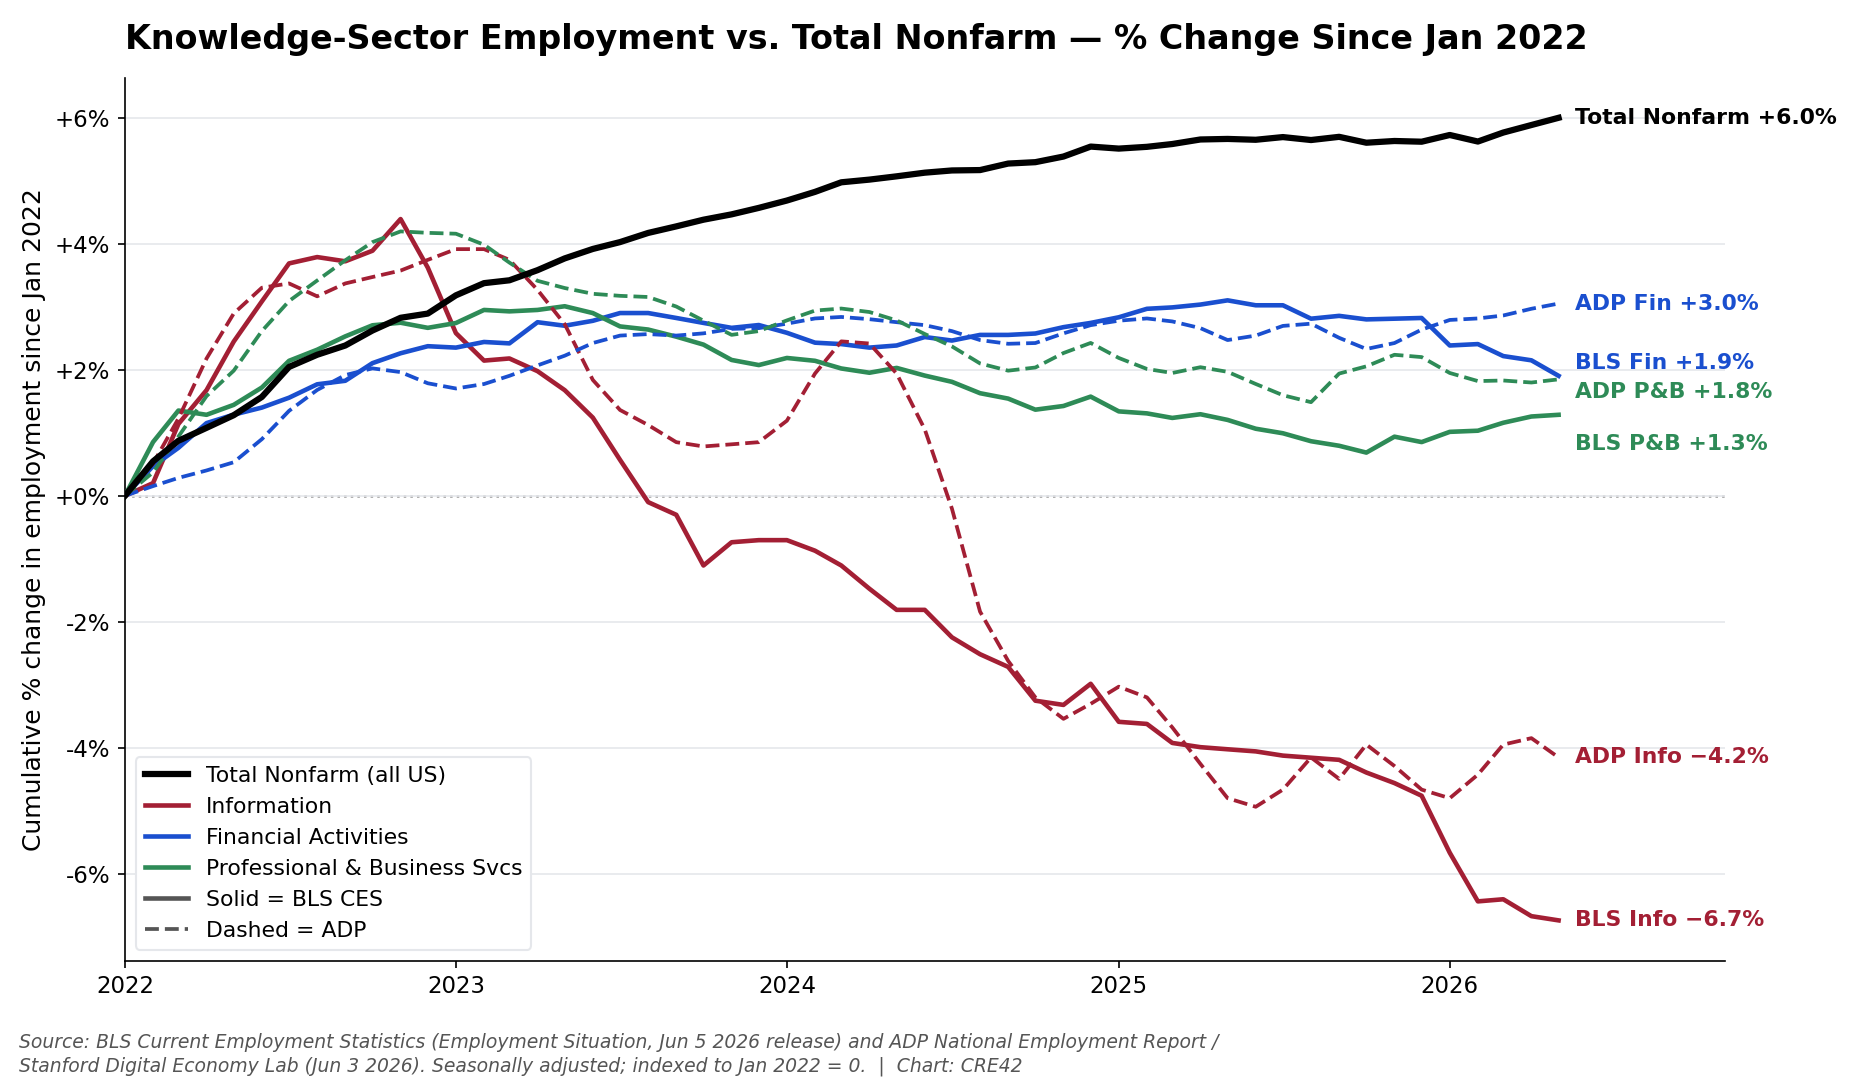
Knowledge-Sector Employment vs Total Nonfarm: % Change Since January 2022 (through August 2026) | Sources: U.S. Bureau of Labor Statistics, Current Employment Statistics, via FRED; ADP National Employment Report history file. Both seasonally adjusted. Solid lines BLS, dashed lines ADP.
Bureau of Labor Statistics data show that from January 2022 through August 2026, total nonfarm employment is up 6.0% (+9.1 million jobs), while the three pure knowledge-work job categories rose 0.7% combined.[9] Information fell 8.0% (−239,000); Financial Activities rose 1.7% (+152,000); Professional and Business Services rose 1.6% (+344,000).
ADP's private-payroll series, compiled from a separate dataset and method, shows the same pattern over the same period: Information down 4.0%, Financial Activities up 3.3%, Professional and Business Services up 1.8%.[10] The two sources differ on magnitude but agree on direction for all three sectors.
Through the first eight months of 2026, BLS Information employment fell by 97,000 jobs year to date, continuing the decline that began after its November 2022 peak; the August data released September 4 showed a further 23,000 drop, the largest monthly decline of the year. ADP's August report (September 2) shows Information up 19,000 year to date, roughly flat.
These payroll trends are consistent with the announced-layoff data in the section above. Challenger job-cut announcements and their AI-attributed share rose through 2025 and the first half of 2026 as knowledge-sector payrolls stagnated or declined. The August drop in AI attributions has no counterpart yet in the payroll data, where Information posted its largest monthly loss of the year.
We are still in the early stages of the AI labor market transformation, and initial predictions regarding vulnerable roles have proven mostly accurate so far. See following section for more details on which jobs and job categories are most susceptible to AI replacement.
AI Exposure by Occupation
Automation exposure is highest in office support, business and finance, and computer and math, while the largest occupation families by headcount sit in the lower-exposure service and production groups.
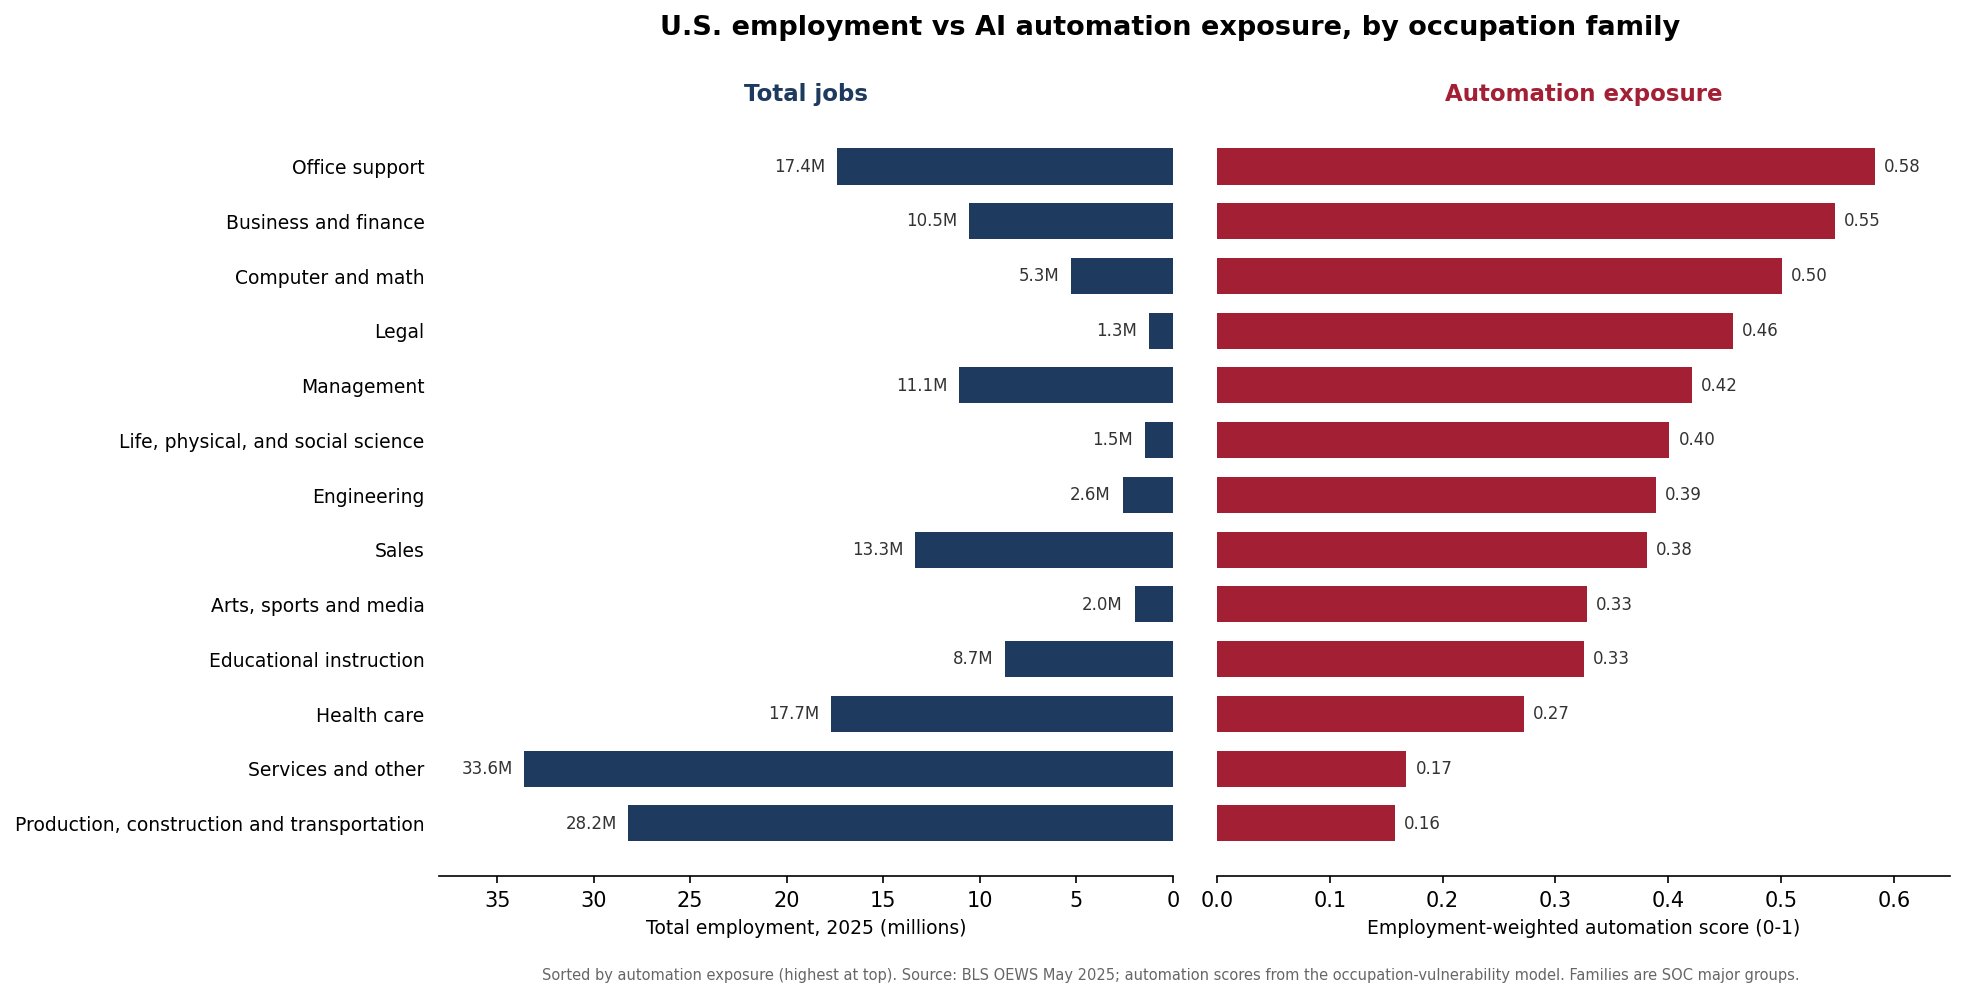
U.S. Employment vs. AI Automation Exposure, by Occupation Family | Source: BLS OEWS (May 2025) for employment; automation scores from the Harvard Business School / OpenAI occupation-vulnerability model, mapped by CRE42.
The analysis scores 772 occupation units, covering roughly 153 million jobs (about 98% of U.S. employment) across 13 occupation families, for exposure to generative AI. Of these, 228 units and 49.6 million jobs fall in the seven knowledge-work families.[11]
Exposure scores come from a Harvard Business School study (Srinivasan, Chen, and Zakerinia, 2024; updated 2025) that used OpenAI's GPT-4o model to rate each occupation's automation and augmentation potential from its underlying O*NET task content. CRE42 mapped those scores to BLS OEWS May 2025 employment at the six-digit SOC level.
Each occupation is assigned to one of four exposure bands by automation score: Low (below 0.20), Moderate (0.20 to 0.35), Elevated (0.35 to 0.50), and High (0.50 and above). Knowledge work concentrates at the top: 55% of knowledge-work employment sits in the High band, versus 21% of total U.S. employment.
Among the 16 high-exposure occupations with more than 500,000 jobs each, combined employment fell 240,730 from May 2024 to May 2025 (table below); the same group was roughly flat over the longer 2022 to 2025 window. Whether 2025 marks an inflection or a noisy year is unresolved; CRE42 will update this figure as each annual OEWS release lands.
| Occupation | Job family | Automation score |
2025 jobs |
Change 2022–2025 | Change 2024–2025 | Band | ||
|---|---|---|---|---|---|---|---|---|
| Jobs | % | Jobs | % | |||||
| Project Management Specialists | Business and Finance | 0.70 | 1,066,670 | +222,760 | +26.4% | +60,510 | +6.0% | High |
| Bookkeeping, Accounting, and Auditing Clerks | Office Support | 0.68 | 1,373,680 | −177,070 | −11.4% | −82,090 | −5.6% | High |
| Medical Secretaries and Administrative Assistants | Office Support | 0.66 | 961,610 | +278,980 | +40.9% | +130,850 | +15.8% | High |
| Receptionists and Information Clerks | Office Support | 0.64 | 910,180 | −100,990 | −10.0% | −54,350 | −5.6% | High |
| Secretaries and Administrative Assistants, Except Legal, Medical, and Executive | Office Support | 0.62 | 1,706,790 | −119,920 | −6.6% | −31,030 | −1.8% | High |
| Office Clerks, General | Office Support | 0.60 | 2,464,940 | −52,410 | −2.1% | −45,610 | −1.8% | High |
| Shipping, Receiving, and Inventory Clerks | Office Support | 0.59 | 816,870 | −31,370 | −3.7% | −40,760 | −4.8% | High |
| Business Operations Specialists, All Other | Business and Finance | 0.58 | 1,087,090 | +5,860 | +0.5% | −41,110 | −3.6% | High |
| Human Resources Specialists | Business and Finance | 0.58 | 912,430 | +77,070 | +9.2% | −5,030 | −0.5% | High |
| Customer Service Representatives | Office Support | 0.57 | 2,595,750 | −284,090 | −9.9% | −130,180 | −4.8% | High |
| First-Line Supervisors of Office and Administrative Support Workers | Office Support | 0.55 | 1,436,680 | −58,760 | −3.9% | −58,900 | −3.9% | High |
| Computer Systems Analysts | Computer and Math | 0.55 | 519,530 | +14,320 | +2.8% | +21,730 | +4.4% | High |
| Market Research Analysts and Marketing Specialists | Business and Finance | 0.54 | 899,580 | +100,960 | +12.6% | +38,440 | +4.5% | High |
| Managers, All Other | Management | 0.53 | 622,190 | +78,900 | +14.5% | −8,790 | −1.4% | High |
| Accountants and Auditors | Business and Finance | 0.51 | 1,449,500 | +47,080 | +3.4% | +1,210 | +0.1% | High |
| Management Analysts | Business and Finance | 0.50 | 898,280 | +89,420 | +11.1% | +4,380 | +0.5% | High |
| Total (16 occupations) | 19,721,770 | +90,740 | +0.5% | −240,730 | −1.2% | |||
Explore all 771 occupations interactively in the AI Exposure Explorer →
Of the 20 highest-scoring occupations, 16 saw employment decline between 2022 and 2025, and 15 declined in the single year from 2024 to 2025.
Footnotes
[1] Challenger, Gray & Christmas, monthly job-cut reports (2023–2026): 2023 Annual via Sep 2024 PDF, 2024 Annual via Sep 2024 "AI Cuts by Industry" table cross-confirmed via 2025 cumulative arithmetic, 2025 Year-End Report (Jan 8 2026), and monthly releases Feb 5, Mar 5, Apr 2, May 7, Jun 4, Jul 1, Aug 6 and Sep 3 2026 (Table 4, Job Cuts by Reason, in each monthly PDF; the May release calls 38,579 "the highest monthly total ever recorded for the reason"). AI was first cited as a reason category in May 2023. challengergray.com (monthly job-cut reports)↩
[2] Challenger, Gray & Christmas, August 2026 release (Sep 3 2026): "Through August, employers have announced 529,914 job cuts, down 41% from the 892,362 cuts announced in the first eight months of 2025. Excluding the Government sector, job cut announcements are down 15% (507,685 versus 597,089 through August 2025)." The same release: August "marks the lowest August total since 2022." Q1 2025 figures were inflated by roughly 282,000 federal government cuts attributed to Department of Government Efficiency actions. challengergray.com (Aug 2026 release)↩
[3] Challenger, Gray & Christmas, August 2026 PDF: "Technology announced 6,103 cuts in August, its lowest monthly total of 2026, for a year-to-date total of 155,126. That is an increase of 52% from the 102,239 cuts announced in this sector through August 2025. Technology still accounts for 29% of all job cuts announced this year, more than any other industry." 2025 full-year Technology total of 154,445 from Challenger 2025 Year-End Report (Jan 8 2026). Shares computed against the 2025 grand total of 1,206,374 (12.8%) and the 2026 year-to-date grand total of 529,914 (29.3%). challengergray.com (Aug 2026 PDF)↩
[4] Computed from Challenger monthly PDFs: April 2026, 33,361 Technology ÷ 83,387 Total = 40.0%; May 2026, 38,242 ÷ 97,006 = 39.4%. The May release: "Technology announced 38,242 job cuts in May, the highest monthly total for the sector since August 2024, when 39,563 cuts were recorded."↩
[5] Computed from Challenger August 2026 PDF Table 2 (job cuts by industry, year-to-date columns). 2025 through August: 892,362 total cuts − 295,273 government = 597,089 ex-government; tech 102,239 ÷ 597,089 = 17.1%. 2026 through August: 529,914 − 22,229 = 507,685 ex-government; tech 155,126 ÷ 507,685 = 30.6%. Multiplier 30.6% ÷ 17.1% = 1.78x. The same calculation on the January to April windows (Apr 2026 PDF) gave 20.0% and 29.5%, 1.47x. challengergray.com (Aug 2026 PDF)↩
[6] U.S. Bureau of Labor Statistics, Current Employment Statistics and Current Population Survey, seasonally adjusted, August 2026 vintage (Employment Situation released Sep 4 2026), accessed via FRED series USINFO, PAYEMS and UNRATE. Information: 3,115,000 in November 2022, 2,745,000 in August 2026 (−370,000, −11.9%); July to August 2026 −23,000. Total nonfarm July to August 2026 +162,000. Unemployment rate: low 3.4% (April 2023), high 4.5% (November 2025), 4.1% in August 2026. bls.gov↩
[7] Andy Challenger, quoted in Challenger, Gray & Christmas April 2026 release (May 7 2026). challengergray.com↩
[8] Challenger, Gray & Christmas commentary on Amazon's January 2026 layoff announcement; Amazon disclosed approximately 16,000 corporate job cuts in late January 2026 with CEO Andy Jassy citing AI as a driver. challengergray.com (Jan 2026 PDF)↩
[9] U.S. Bureau of Labor Statistics, Current Employment Statistics (Establishment Survey), seasonally adjusted, January 2022 through August 2026, accessed via FRED series PAYEMS (total nonfarm), USINFO (Information), USFIRE (Financial Activities), and USPBS (Professional and Business Services). August 2026 figures from the Employment Situation released September 4, 2026; earlier months as revised in that vintage. bls.gov/ces↩
[10] ADP Research / Stanford Digital Economy Lab, ADP National Employment Report, private-sector employment, seasonally adjusted, Industry series (Information; Financial activities; Professional and business services) from the ADP NER history file downloaded September 2, 2026, which carries the August 2026 report released that day. ADP covers private employers only and is built from anonymized payroll records of more than 25 million U.S. employees. adpemploymentreport.com↩
[11] CRE42 groups the 13 SOC major occupation families into three work types. Knowledge work (7 families): Management; Business and Finance; Computer and Math; Engineering; Life, Physical, and Social Science; Legal; and Office Support. Hybrid (4 families): Arts, Sports, and Media; Educational Instruction; Health Care; and Sales. Physical (2 families): Services and Other; and Production, Construction, and Transportation.↩
[12] Challenger, Gray & Christmas, July 2026 release (Aug 6 2026): "Challenger uses this categorization ["Technological Update (possibly AI)"] when a company states new technology was the main reason for layoffs and AI is alluded to but not directly tied to the cuts. Challenger tracked 20,219 cuts for this reason in 2025." Both quotations are Andy Challenger in the same release. challengergray.com (Jul 2026 release)↩
Companion workbook. technology-knowledge-ai-workplace-adoption.xlsx — Challenger job-cut data with AI attribution, BLS/ADP monthly knowledge-sector employment, HBS/OpenAI occupation automation scores mapped to BLS OEWS, and 2022–2025 employment-change analysis