
San Francisco: A Live Test of Automation and Driver Work
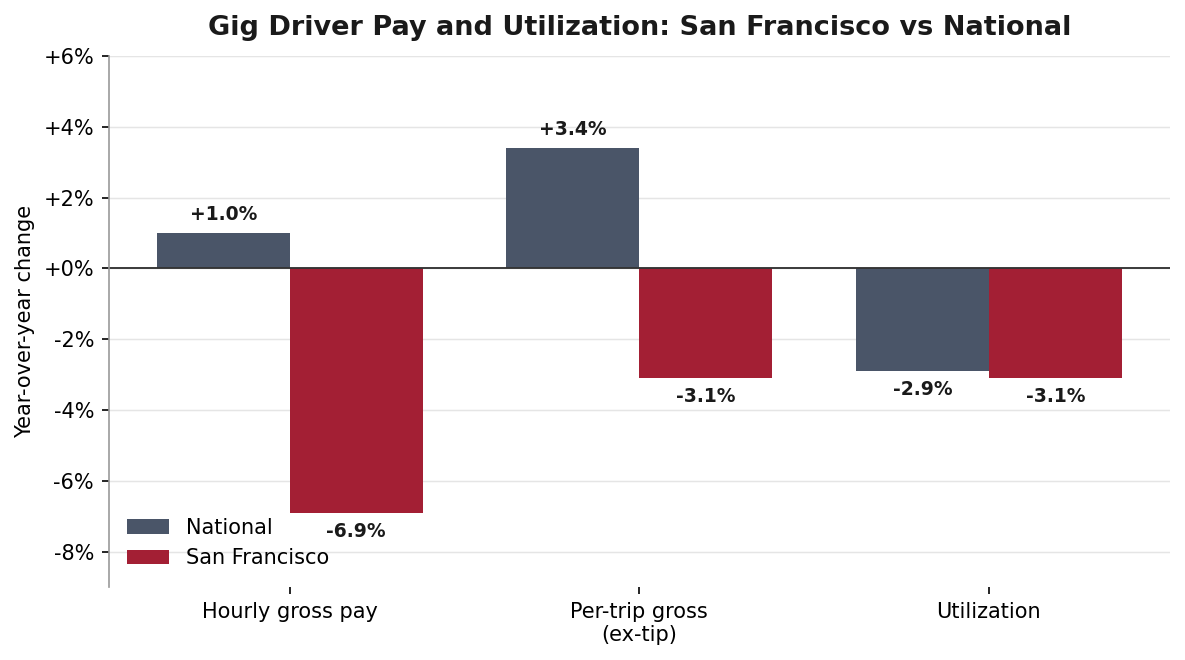
Year-over-year change in gig driver pay and utilization[1], San Francisco vs national, July 2024 to July 2025 | Source: Gridwise AV Impact Report. Driver-app panel; gross earnings excluding tips.
Key Observations
- Waymo passed one million paid trips a month in California by late 2025 and ran between 1.2 and 1.5 million a month through the first half of 2026, with 55 to 59% of its miles carrying a passenger[2]
- Estimates of its share of the San Francisco paid market range up to 27%[3]
- San Francisco human driver pay appears to have decreased both on a per hour and per ride basis
San Francisco is the first city in which Waymo operated at scale and now is firmly entrenched as a significant component of the city’s overall paid transportation system. This dynamic is relatively new and statistics remain challenging. Yet it certainly appears at this point that despite a renewing economy riding the AI wave, San Francisco ride-share and taxi drivers are feeling the competition from automated vehicles, primarily Waymo. CRE42 will track these developments in San Francisco and other cities into which Waymo, Tesla, Zoox, and others are expanding.
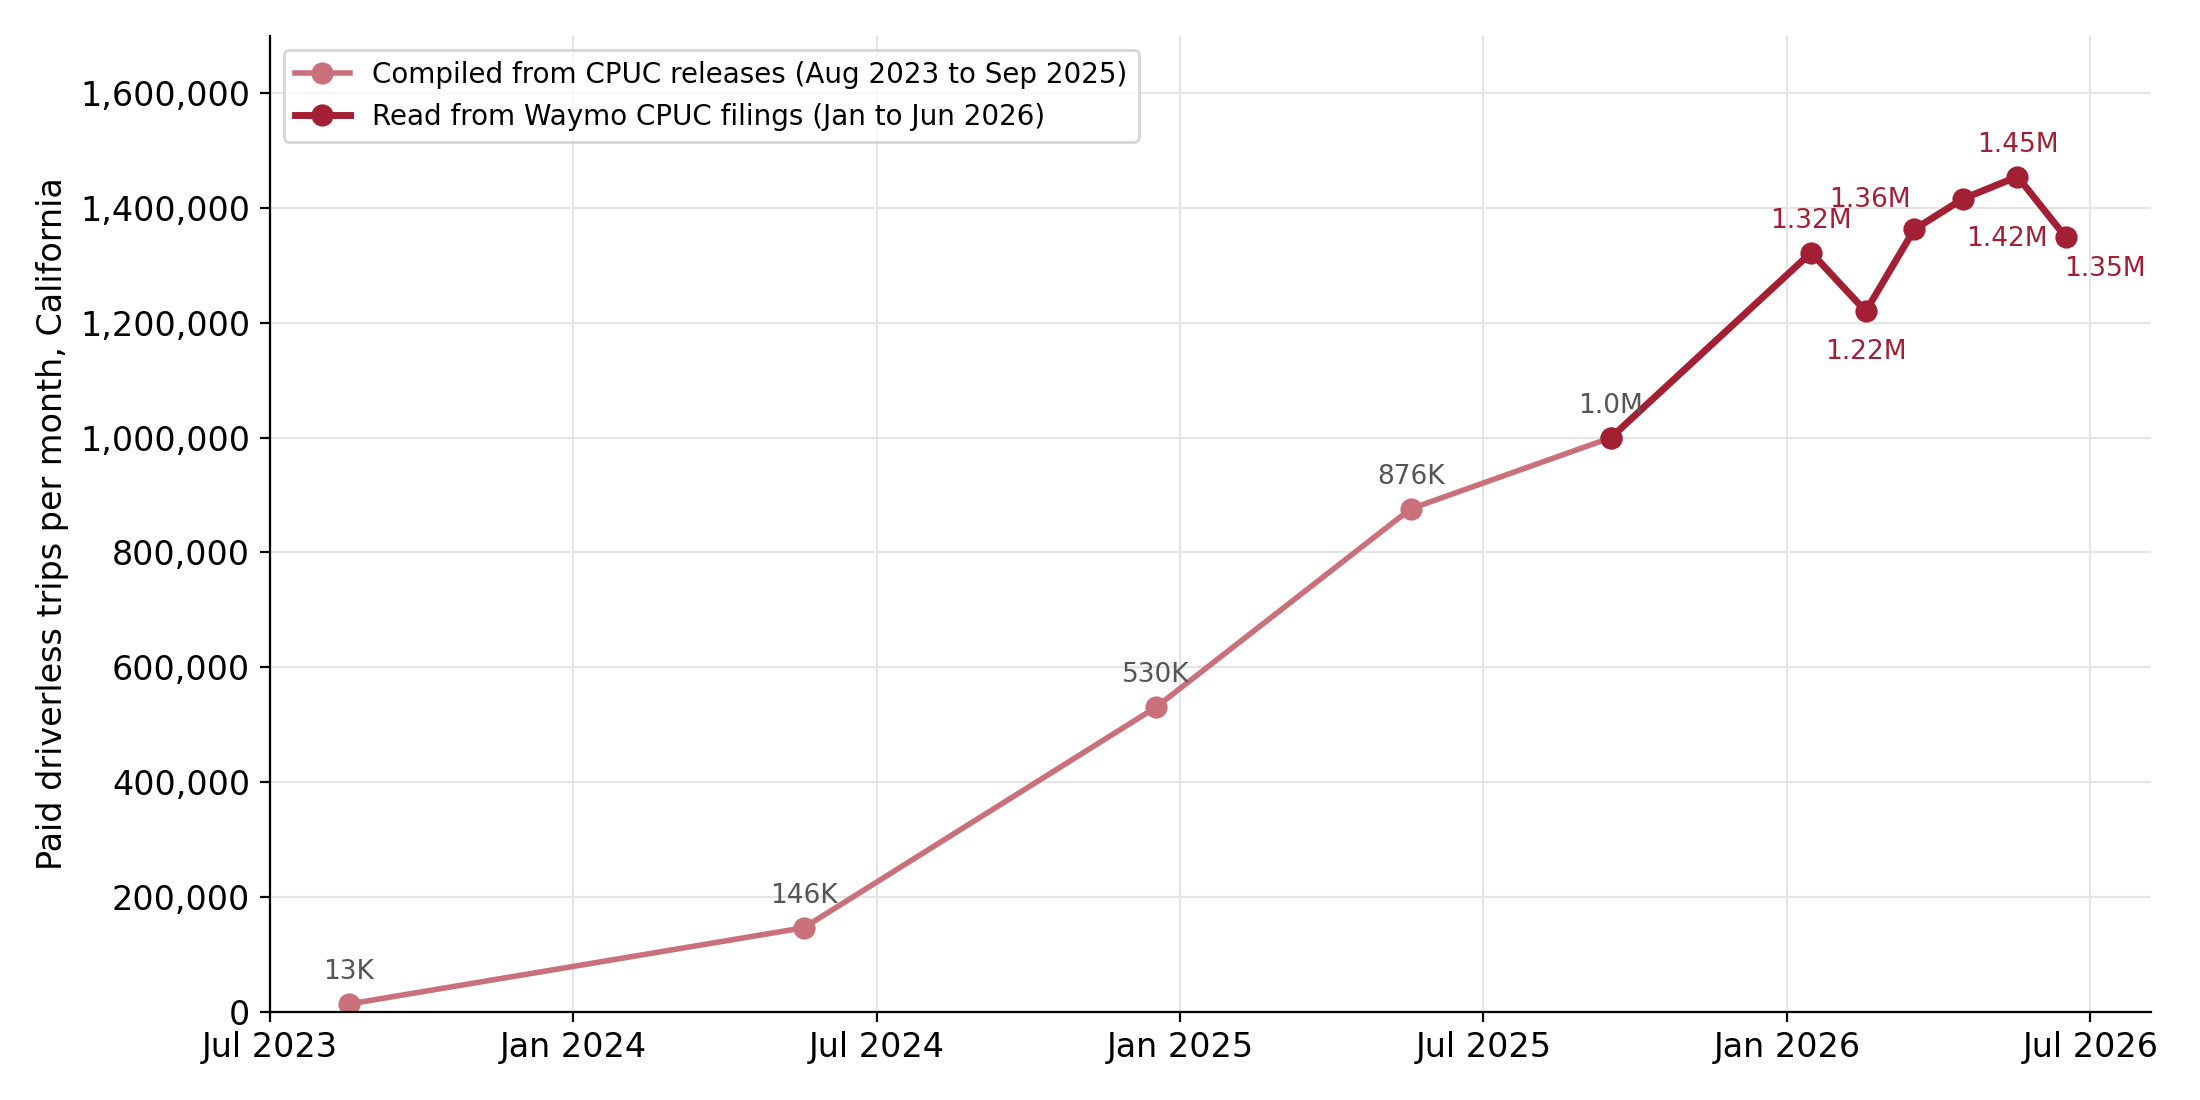
Waymo paid driverless trips per month, California, August 2023 to June 2026 | Source: CPUC autonomous vehicle quarterly deployment reports (Waymo LLC filings); points through September 2025 compiled from CPUC releases, January to June 2026 read directly from the filings.[2]
Total driving jobs by category (USA)
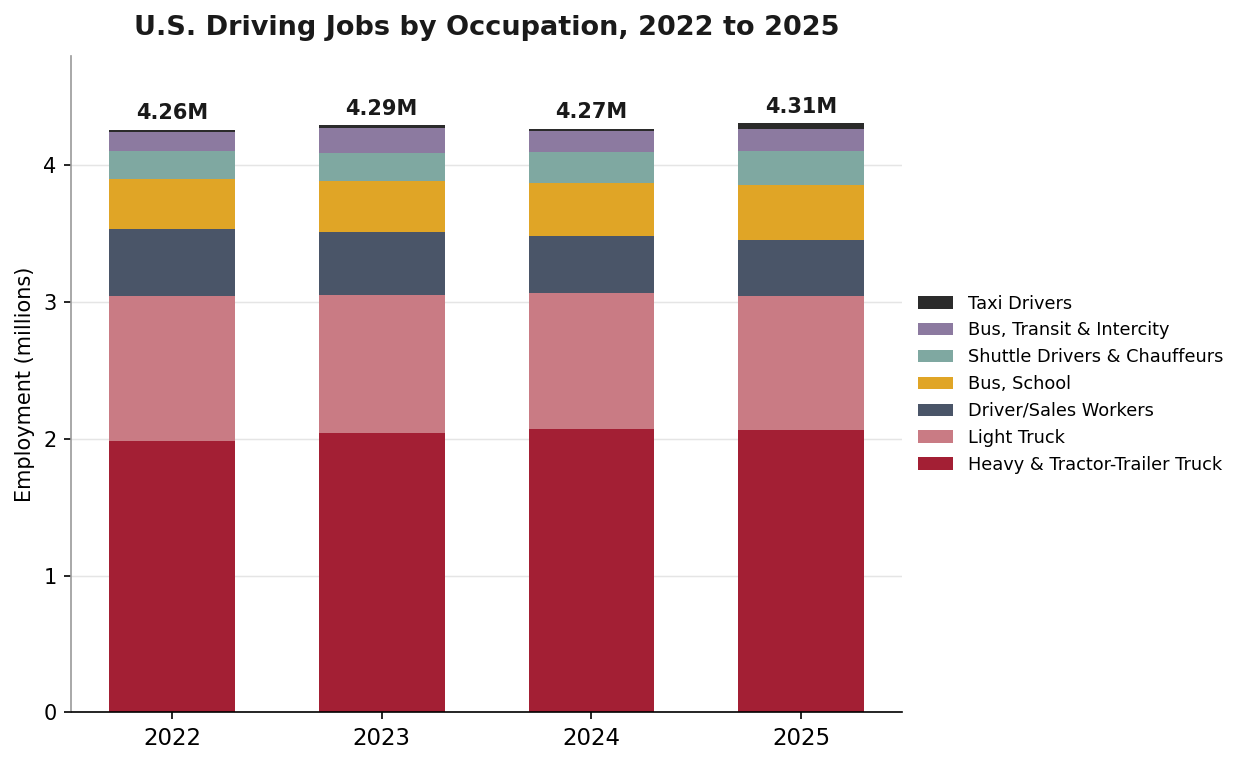
U.S. driving jobs by occupation, seven motor-vehicle driving occupations, 2022 to 2025[4] | Source: BLS Occupational Employment and Wage Statistics (May each year).
Key Observations
- U.S. driving jobs totaled about 4.3 million in 2025, up roughly 1.2% (about 50,000 jobs) from 2022, or about 2.8% of total U.S. employment[5].
- Heavy tractor-trailer and light truck drivers together account for about 3.0 million jobs, roughly 71% of the total, with heavy tractor-trailer alone near 2.06 million, the single largest driving occupation.
- Direct passenger-carrying work (taxi plus shuttle and chauffeurs) was about 290,000 in 2025, representing less than 7% of total driving jobs.
- This roughly 4.3 million is the scale of employment potentially exposed to vehicle automation over time; the stability of the total indicates automation has not yet visibly moved the aggregate, consistent with its still-early commercial stage.
[1] Utilization is the share of a driver’s logged-in working time spent carrying a passenger, derived by Gridwise from driver-side records of work hours and idle time. ↩
[2] California Public Utilities Commission, autonomous vehicle quarterly deployment reports (Waymo LLC). California monthly paid driverless trips surpassed 1,000,000 by September 2025 (compiled from CPUC releases); the Q1 and Q2 2026 filings report 1.32M (Jan), 1.22M (Feb), 1.36M (Mar), 1.42M (Apr), 1.45M (May) and 1.35M (Jun) trips, with passenger-on-board miles between 55% and 59% of total miles. Statewide, not San Francisco only. A peer-reviewed analysis of the same filings (Abdelhalim, Findings, May 2026) reports 13.8 million California trips from August 2023 to December 2025. ↩
[3] Yipit and Bond Capital, April 2025: Waymo near 27% of spend within its San Francisco operating zone. Citywide and trip-based shares are lower, since Waymo’s higher fares lift its spend share above its trip share. ↩
[4] BLS advises against treating OEWS as a strict time series, since consecutive releases share most of their sample; the 2022-to-2025 comparison (non-overlapping samples) is a cleaner read than any single adjacent-year step. ↩
[5] Share of total U.S. employment: about 4.31 million driving jobs divided by about 153.1 million (153,068,610), the summed May 2025 OEWS employment across detailed occupations, equals 2.8%. The BLS OEWS all-occupations total (155,495,730) gives the same 2.8%. Source: BLS Occupational Employment and Wage Statistics, May 2025. ↩
Companion workbook. technology-transportation-ai-jobs-research.xlsx: U.S. driving jobs by occupation (BLS OEWS), Waymo national weekly rides, California monthly trips and miles (CPUC, through June 2026), gig driver pay and utilization (Gridwise)