
REIT Metrics & Pricing Signals
Data: CRE42 industrial REIT composite (component filings); Green Street, May 2026; FRED (10-year UST).
This page covers the pricing signals that the public market attaches to the same composite. Where the fundamentals page traced rents, supply, and values, this page reads the entry yield: the composite implied cap rate against Treasuries, the equity yield that leverage adds on top, and how public pricing has led private-market cap rates through the cycle. All figures use the CRE42 industrial REIT composite on a single-REIT-equivalent (TEV-weighted) basis.
Composite Implied Cap Rate vs. 10-Yr UST (2016–2025)
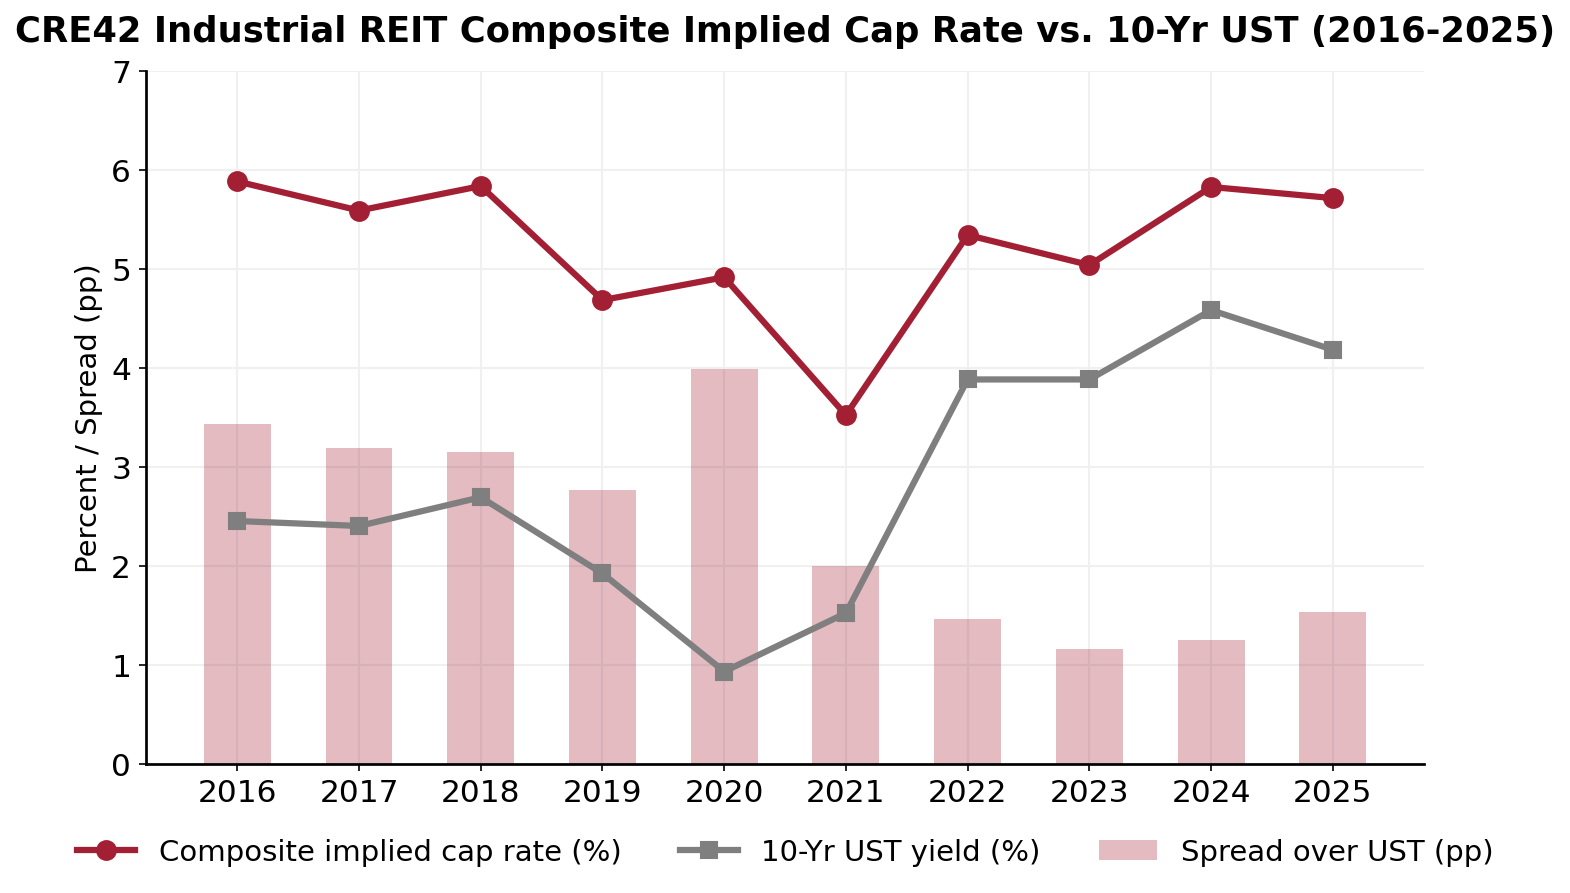
Sources: CRE42 industrial REIT composite (component filings; CRE42-derived implied cap rate); FRED series DGS10, year-end.
Composite Cap Rate vs. Leveraged Equity Yield (2016–2025)
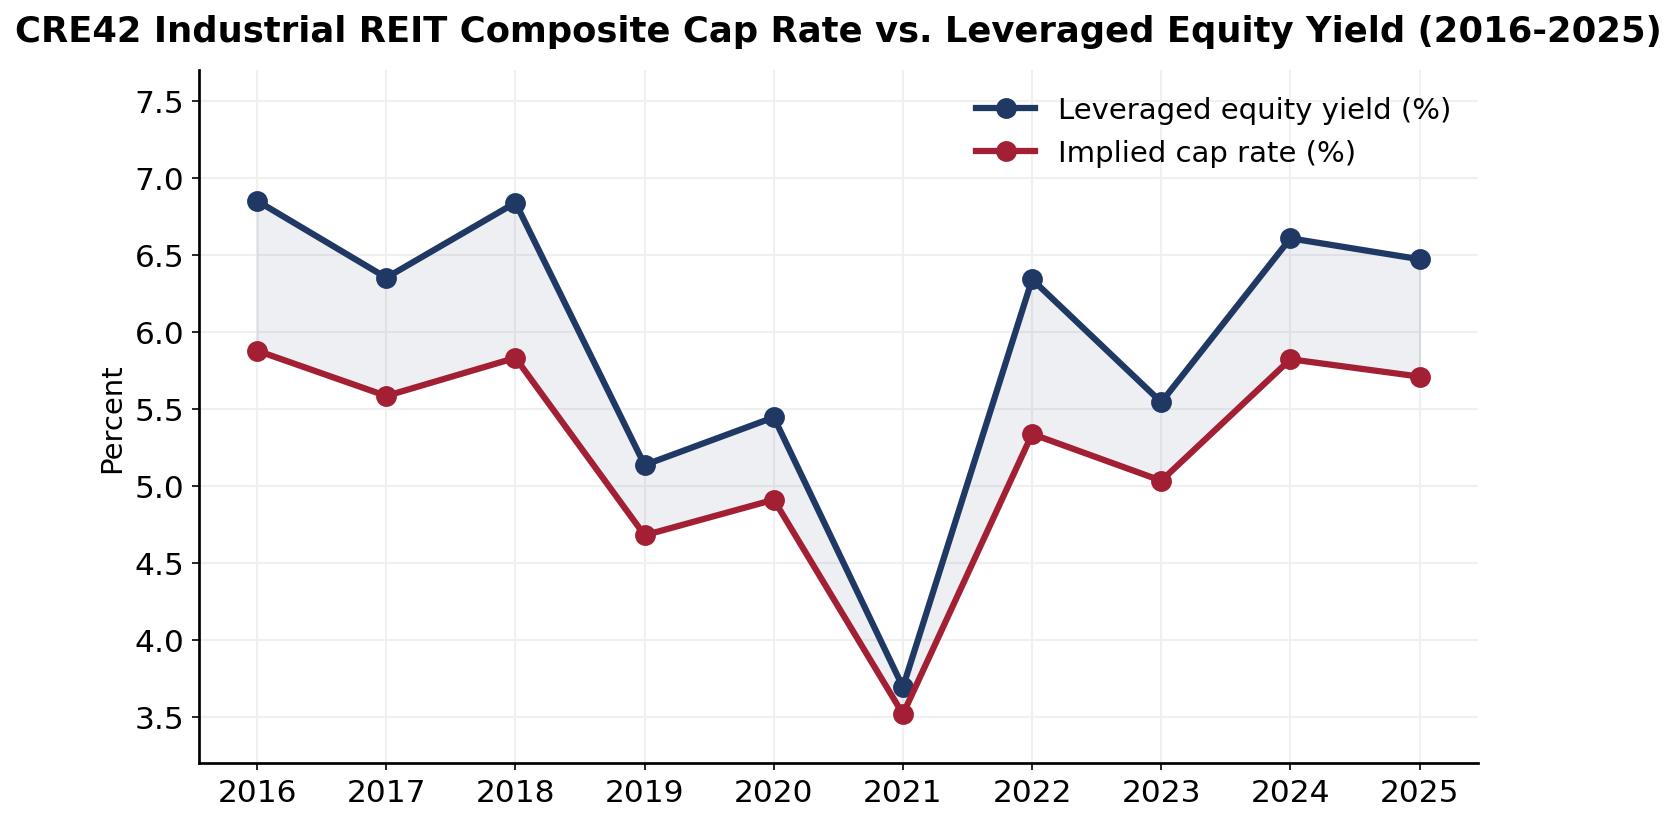
Source: CRE42 industrial REIT composite (component filings); CRE42-derived measures.
Public vs. Private Industrial Cap Rates (2016–2025)
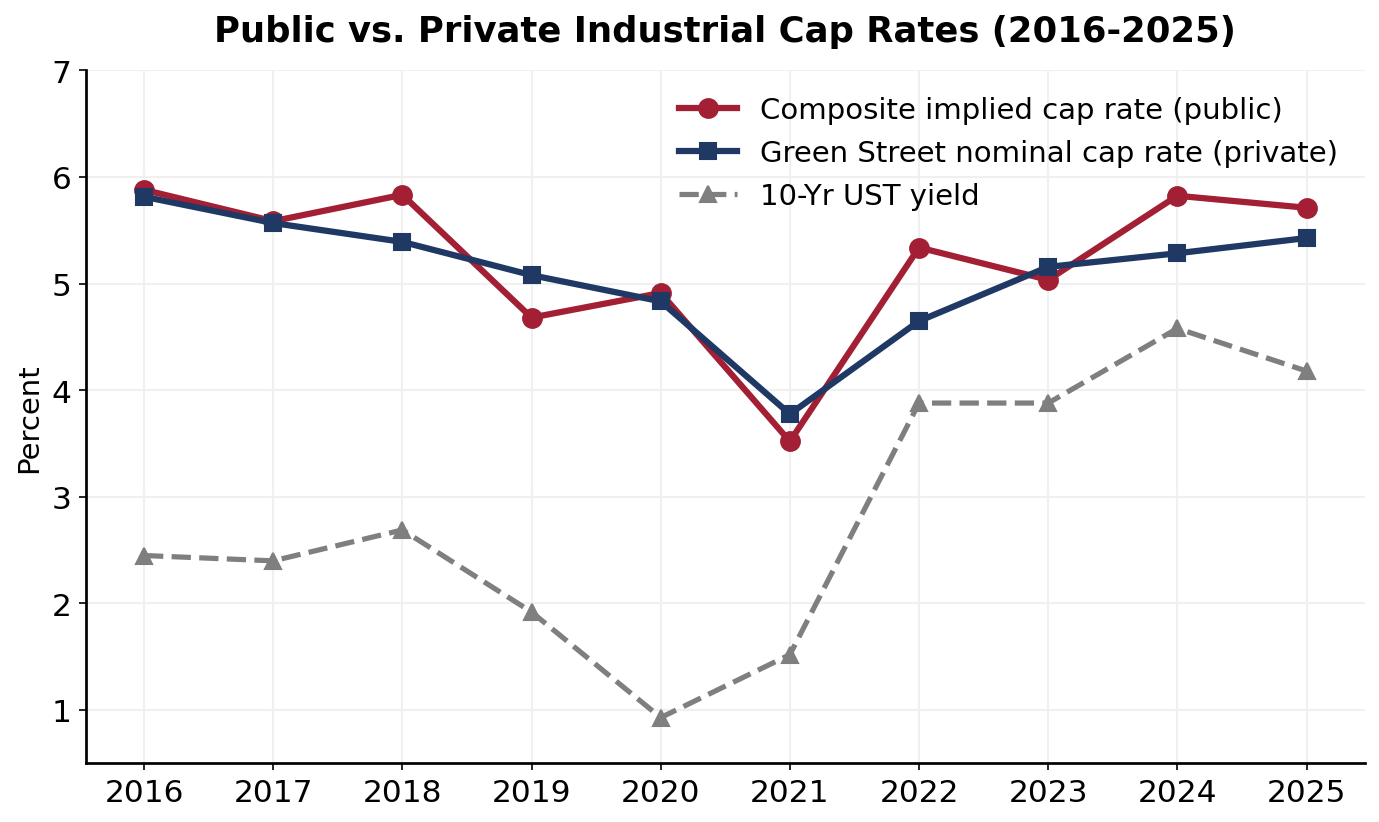
Sources: CRE42 industrial REIT composite (public); Green Street nominal cap rate, 51-market weighted average, 4Q values, May 2026 (private); FRED DGS10.
Notes
Composite figures are a stabilized-TEV-weighted blend of EastGroup, First Industrial, and STAG, constructed to read like a single mid-sized industrial REIT; see the CRE42 Industrial REIT Composite page for methodology. Implied cap rate = annual NOI / stabilized total enterprise value. Leveraged equity yield = (NOI less net interest) / stabilized equity market cap. Spread over UST and leverage contribution are in percentage points. The Green Street private series is a 51-market weighted-average nominal cap rate at 4Q; the public and private measures are constructed on different bases and are compared for direction and level, not as identical instruments.
Companion workbook. industrial-reit-metrics.xlsx – CRE42 industrial REIT composite annual model (FY2016–FY2025), per-REIT and vs-market tabs, and market comparison data.