
Industrial REIT Metrics & Current Cycle, 2016–2025
Industrial Real Estate 10-Year Cycle: Highlights and Summary
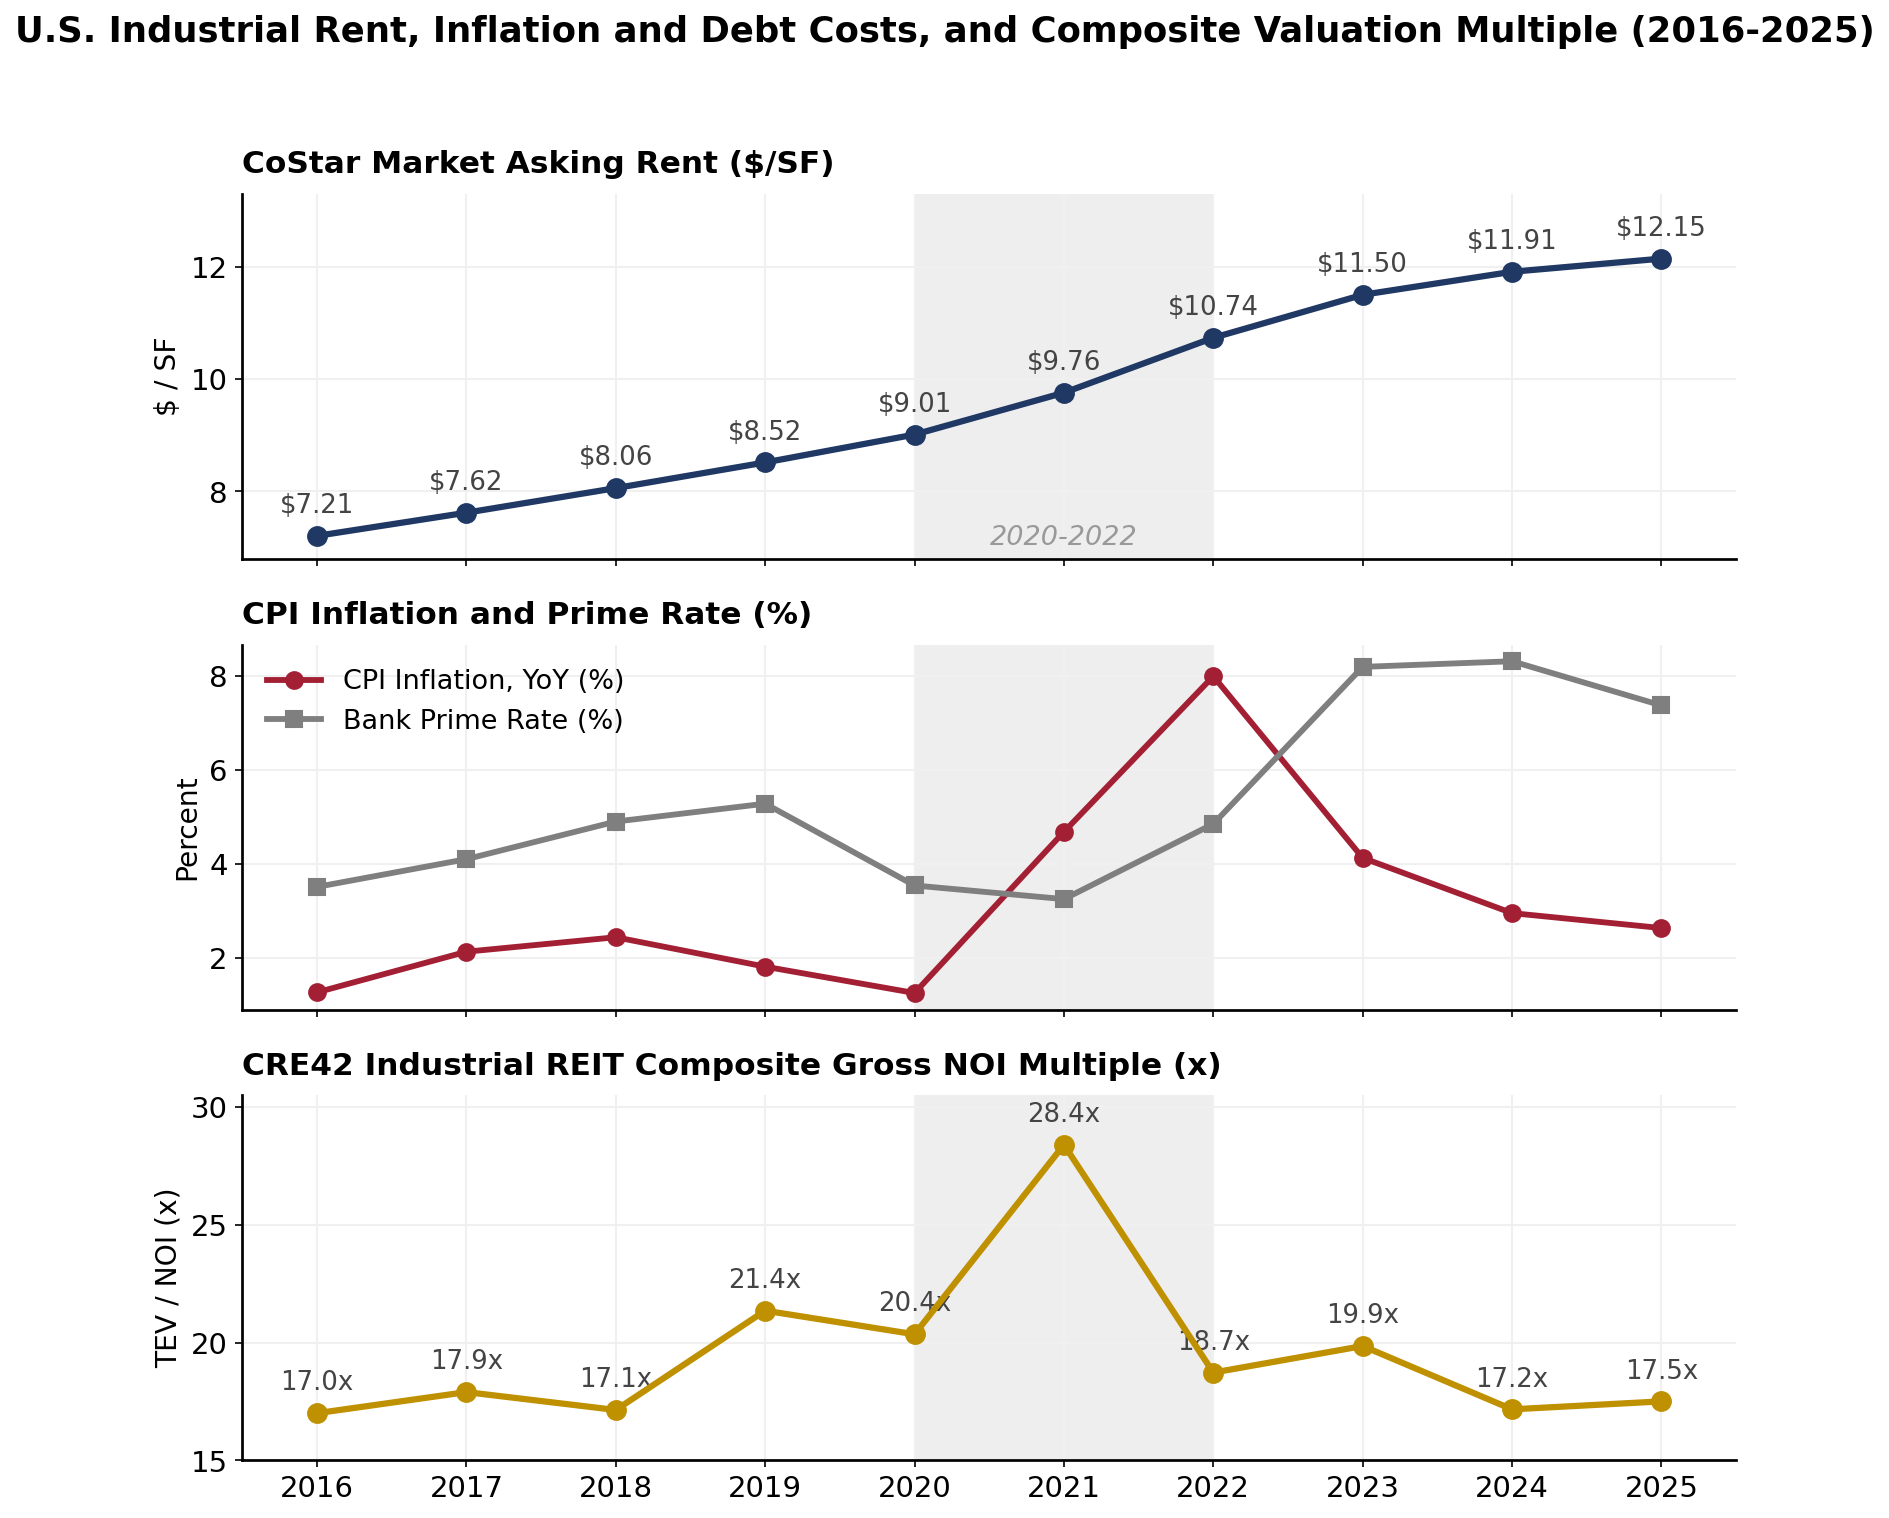
Sources: CoStar, March 2026 (rent); FRED series CPIAUCSL and MPRIME (inflation, prime rate); CRE42 industrial REIT composite (component filings), CRE42-derived multiple.
U.S. industrial real estate was in full recovery and expansion mode in 2016. The sector had recovered with the broader economy after the global financial crisis, and e-commerce growth through the mid-2010s added steady demand for warehouse and distribution space. Rent growth accelerated and occupancy reached record levels following the Covid-19 pandemic, pushing industrial REIT multiples and valuations to cyclical highs. Developers reacted with record supply, delivering from 2022 through 2025, as demand gradually softened. National occupancy fell roughly 360 basis points and annual rent growth slowed from 10% to 2%. At the same time, the 2022 inflation spike pushed borrowing costs sharply higher, and valuations reset. To read these movements through public-market data, CRE42 builds a three-REIT composite (EastGroup, First Industrial, STAG) whose construction and cross-section are detailed on the CRE42 Industrial REIT Composite page; the combined figures are referenced throughout this cluster. In 2026 demand is recovering, ongoing deliveries have slowed and construction starts have experienced a dramatic reduction, all pointing to a wide operational recovery.
Cycle Inflection Point: 2020–2022
The highlighted box in the chart above isolates the time period from 2020 to 2022, illustrating the interplay of macro-economic forces. On the bottom portion of the chart, we can see a rapid rise and fall in valuation multiple, also illustrated below and reflected in Total Enterprise Values (chart below). This valuation movement is unusual in the sense that it all occurred along with consistently rising NOI and revenue numbers across the board within the industry. The rapid rise from 2020 through 2021 was based on low and falling debt and inflation rates along with expectations for continuing NOI increases. Industrial rents, revenues and NOI did, in fact, continue to increase, but valuations were reduced dramatically in 2022 due to rapidly rising inflation and the expectations (later confirmed) of increasing debt rates.
Debt Metrics Overpower Operating Metrics Part I: NOI (Unlevered)
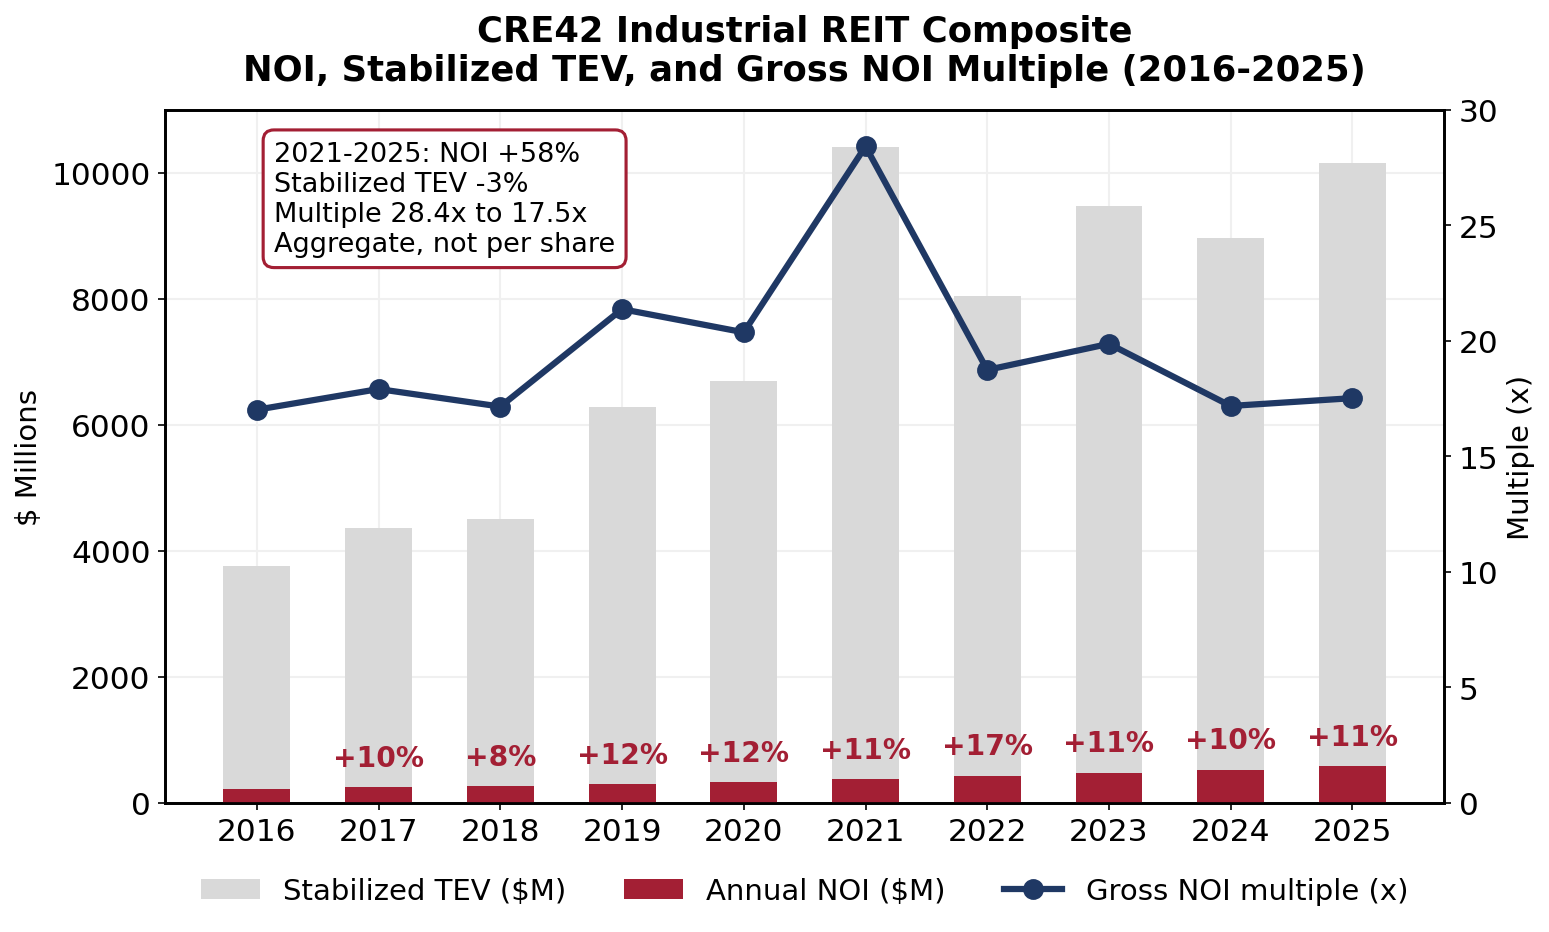
Source: CRE42 industrial REIT composite (component filings); CRE42-derived measures. Composite figures on a single-REIT-equivalent (TEV-weighted) basis.
Debt Metrics Overpower Operating Metrics Part II: Leveraged CF
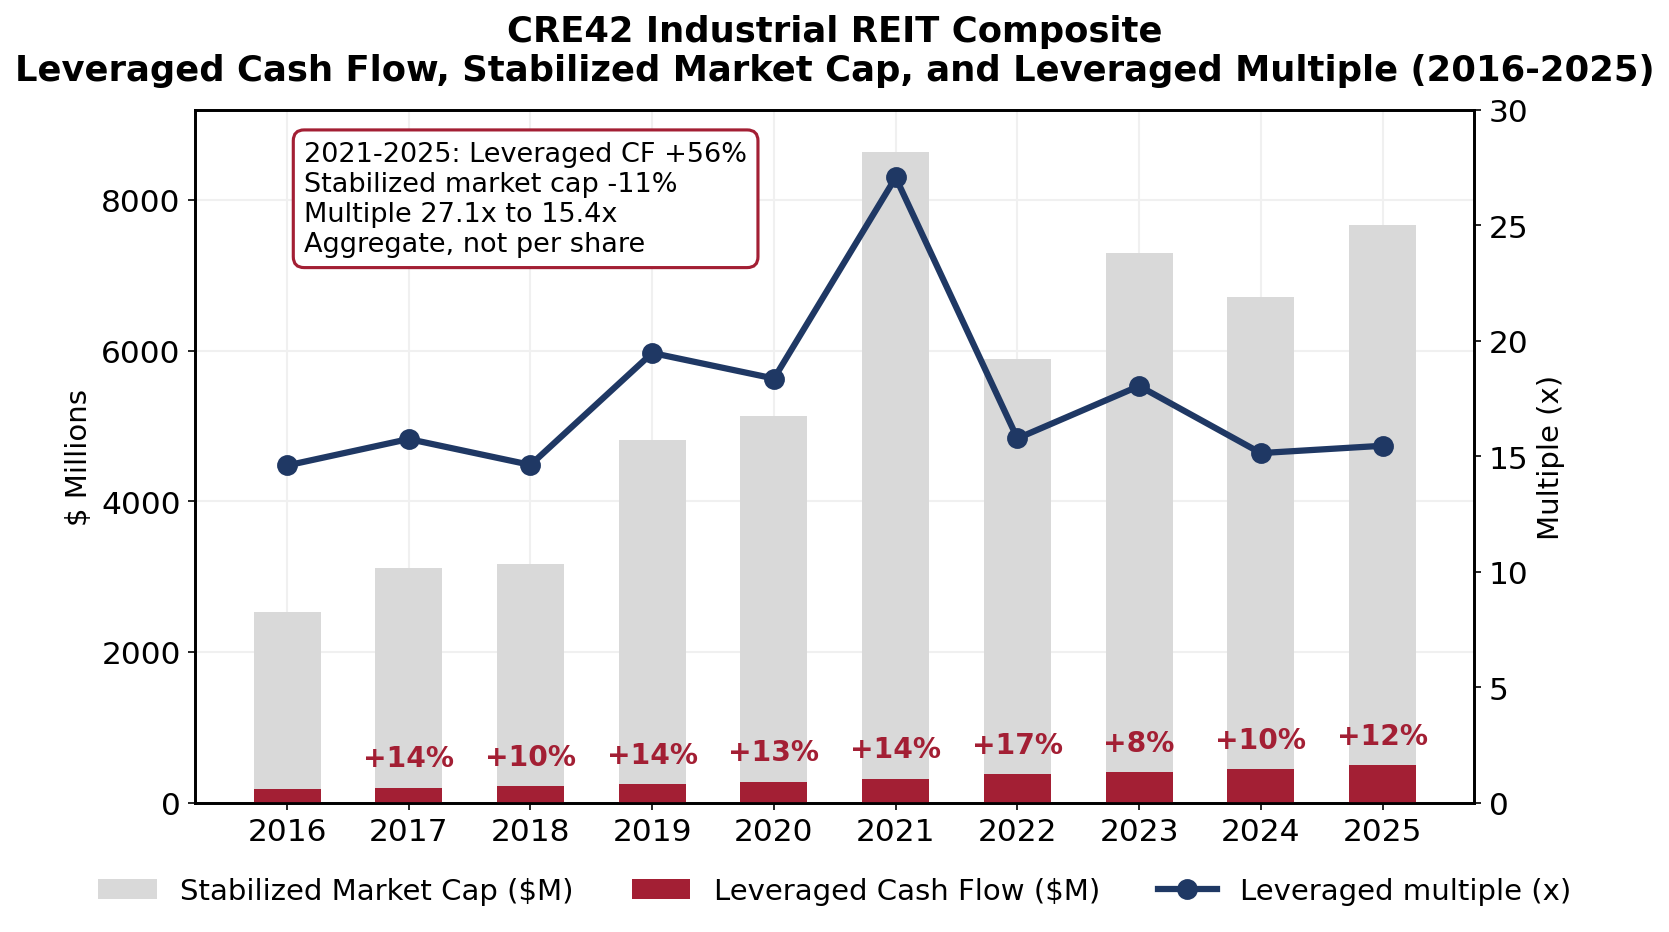
Source: CRE42 industrial REIT composite (component filings); CRE42-derived measures. Composite figures on a single-REIT-equivalent (TEV-weighted) basis.
Notes
Composite figures are a stabilized-TEV-weighted blend of EastGroup, First Industrial, and STAG, constructed to read like a single mid-sized industrial REIT; see the CRE42 Industrial REIT Composite page and the companion model workbook for methodology. Gross NOI multiple = stabilized total enterprise value / annual NOI; leveraged multiple = stabilized equity market cap / leveraged property cash flow. All dollar figures are aggregate composite, not per share.
Companion workbook. industrial-reit-metrics.xlsx – CRE42 industrial REIT composite annual model (FY2016–FY2025), per-REIT and vs-market tabs, and market comparison data.