The federal government has run a deficit in 26 of the past 30 fiscal years.
In FY2025 net interest reached $970 billion and became the larger component of the deficit, exceeding the $805 billion “primary” (i.e. non-interest) deficit for the first time in the era of trillion-dollar deficits.
Spending Has Outrun Receipts for Three Decades
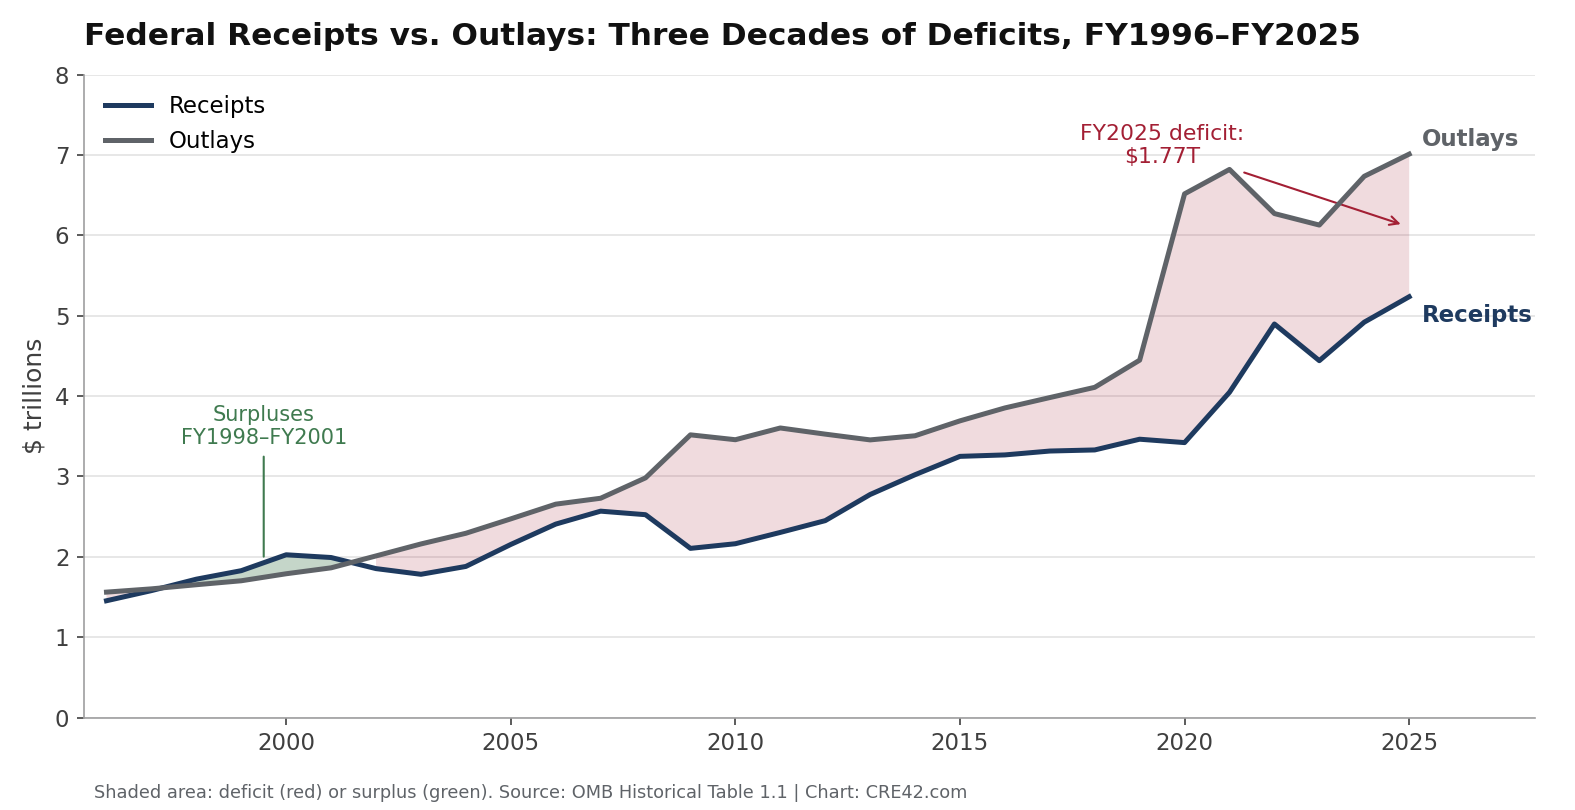
Two lines and the space between them: the shaded gap is the deficit (red) or surplus (green). Source: OMB Historical Table 1.1 | Chart: CRE42.com
US government receipts increased by 3.6x from 1996–2025, from $1.45 trillion in FY1996 to $5.24 trillion in FY2025.
But US government outlays increased almost 4.5x, from $1.56 trillion to $7.01 trillion.
The four surplus years, FY1998–FY2001, are the only green in the window; the gap has been red in every year since.
Interest Is Now the Larger Component of the Deficit
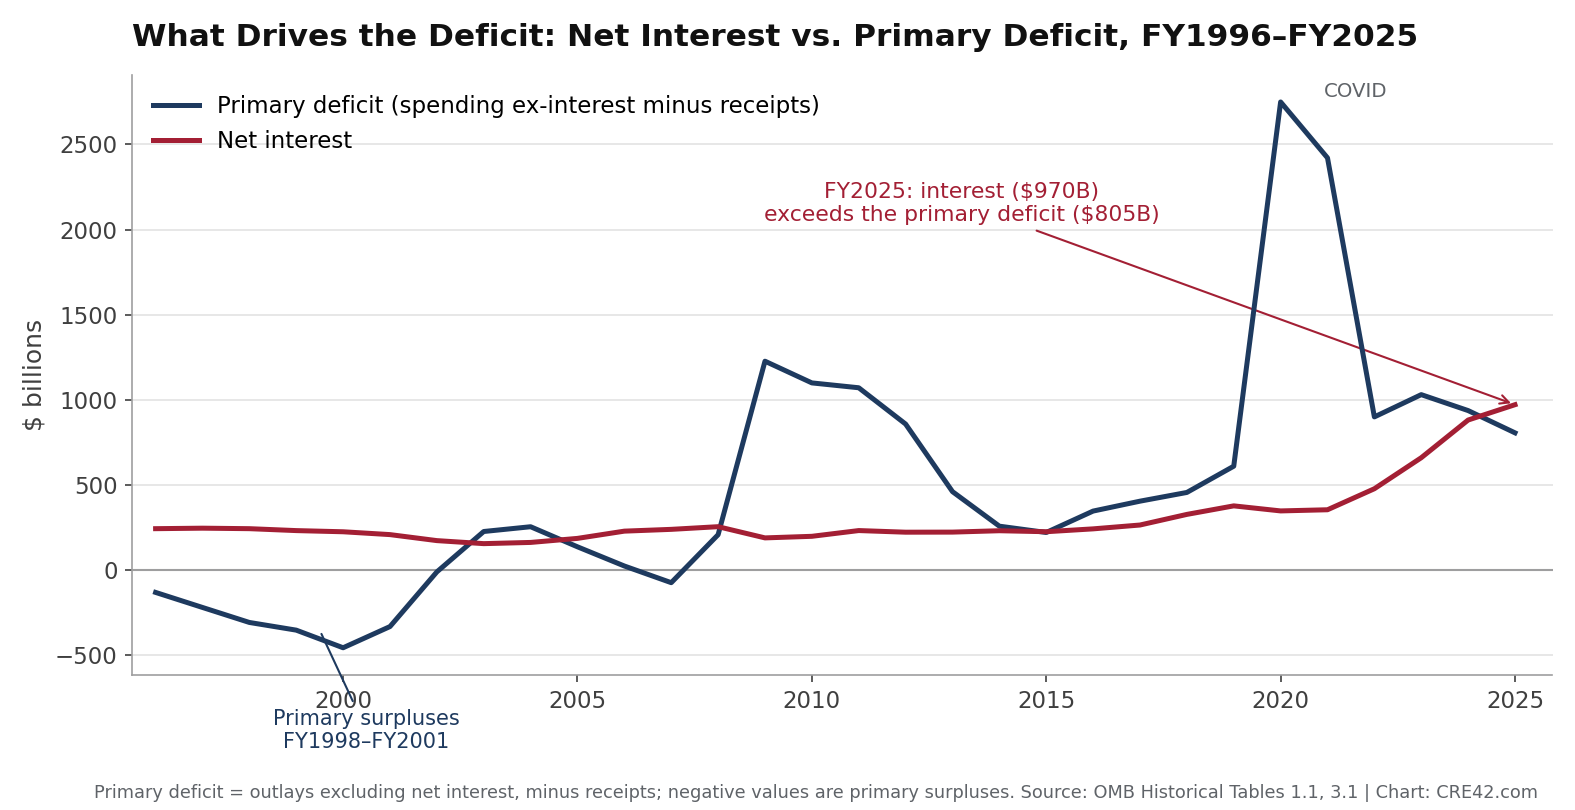
The deficit split into its two components. Primary deficit = outlays excluding net interest, minus receipts; negative values are primary surpluses. Sources: OMB Historical Tables 1.1, 3.1 | Chart: CRE42.com
In FY2025 net interest ($970 billion) crossed above the primary deficit ($805 billion): more of the deficit now comes from servicing past borrowing than from current spending in excess of receipts.
The two lines nearly touched once before, in FY2015 ($223 billion of interest against a $219 billion primary deficit), but at less than a quarter of today’s scale and with interest flat rather than climbing.
The COVID response pushed the primary deficit to $2.75 trillion in FY2020. It has since fallen back by more than two-thirds, while net interest nearly tripled from its FY2021 level of $352 billion.
The primary deficit responds to policy each budget year; net interest is the compounding echo of every past deficit, and can only be slowed by lower rates or smaller debt.
Interest Consumes a Growing Share of Receipts
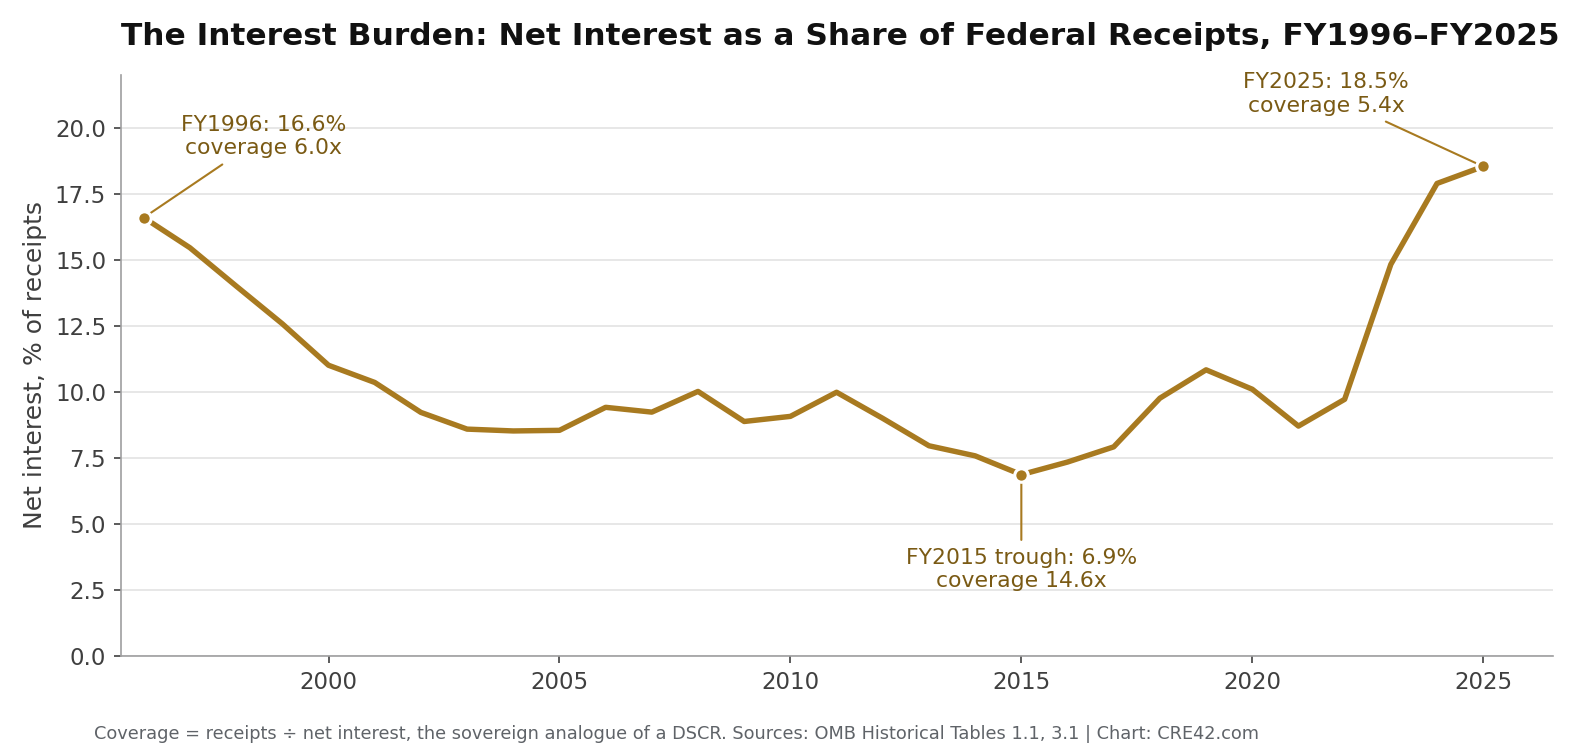
Coverage = receipts ÷ net interest, the sovereign analogue of a lender’s debt service coverage ratio. Sources: OMB Historical Tables 1.1, 3.1 | Chart: CRE42.com
Interest payments comprised 16.6% of receipts in FY1996, fell to 6.9% by FY2015 as rates declined faster than debt grew, and reached 18.5% in FY2025, above the 1990s peak.
In credit terms, interest coverage was down to 5.4x in FY2025, from 14.6x at the FY2015 trough.
US Government Debt Rates Continue Rising
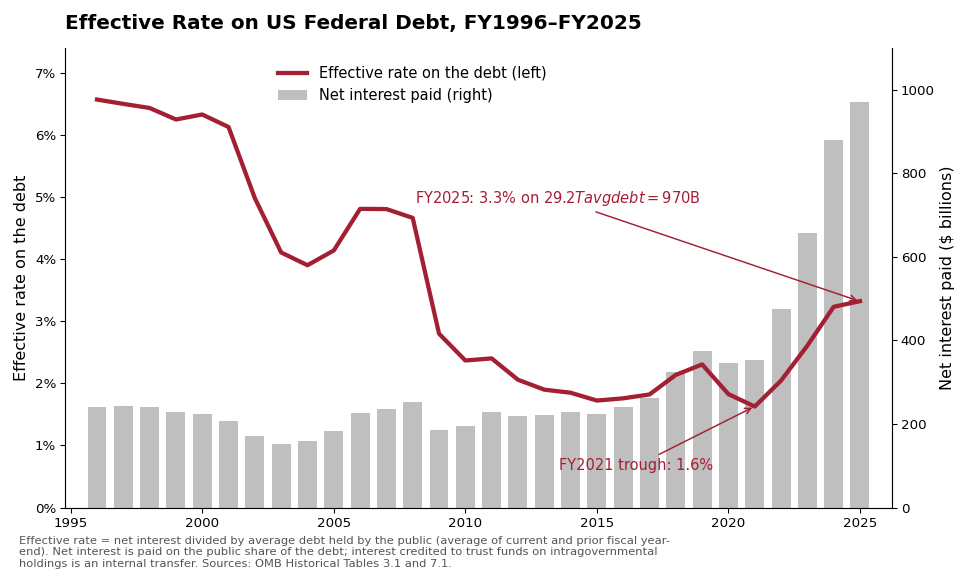
The effective rate is what the Treasury actually pays: net interest divided by average debt held by the public. Sources: OMB Historical Tables 3.1, 7.1 | Chart: CRE42.com
The effective interest rate on U.S. federal debt fell from 6.6% in FY1996 to a trough of 1.6% in FY2021, then rebuilt to 3.3% by FY2025. The FY2025 rate is half the FY1996 rate, yet dollar interest is four times larger, $970 billion against $241 billion as the total debt increased from $3.7 trillion to $29.2 trillion.
Assuming market rates remain near the FY2025 average 10-year Treasury yield of 4.3%, the effective rate reaches approximately 4.2% by FY2030 on refinancing alone. Each 10 basis points adds roughly $30 billion of annual interest at the current debt base, and the base itself grows with each year’s deficit, $1.77 trillion in FY2025.
▶ Future Federal Debt: Interactive Estimation Model
The model starts from FY2025 actuals (receipts $5,236B, operating outlays $6,041B, net interest $970B, debt held by the public $30,167B) and projects fifteen years based on your selection of variables. The effective rate converges toward your market rate at one-third of the gap per year, the calibrated repricing speed.
* Coverage ratio = receipts divided by net interest: how many times over the government’s revenue covers the interest on its debt. It is the sovereign analogue of the debt service coverage ratio a lender computes on a property, with two differences: the numerator is gross revenue rather than net operating income, and the denominator is interest only, because the Treasury refinances principal at maturity rather than amortizing it. FY2025 actual: 5.4x.
For educational purposes only, this is not a forecast; every path is determined by the four user-set assumptions. The model runs on debt held by the public, the share that bears market interest; total debt adds intragovernmental holdings, held flat at the FY2025 level of $7,208B, since trust fund balances turn on demographics rather than on any assumption above (see the reconciliation on the Debt Comparisons tab of the companion workbook). Interest is charged on average debt during the year. Default settings are illustrative round numbers near recent history, not projections. GDP base: BEA calendar-year 2025.
What to Watch For in 2026 and Beyond
Sources to Track the Federal P&L:
| Source | Report or Series | Frequency | Notes |
|---|
| U.S. Treasury | Monthly Treasury Statement (MTS) | Monthly; Final in October | Receipts, outlays, deficit; official FY figures |
| OMB | Historical Tables 1.1, 3.1, 7.1 | Annual, with the Budget | The consistent long series behind both charts |
| U.S. Treasury | Average Interest Rates on Treasury Securities | Monthly | Marginal vs. average rate; the repricing gap |
| U.S. Treasury | Quarterly Refunding statements | Quarterly | Issuance mix: bills vs. coupons sets repricing speed |
| FRED | GS10 | Daily | Market-rate proxy used in the calibration |
Footnotes
Methodology & Data Notes
Companion Workbook
inflation-debt-in-context.xlsx: companion workbook for the Federal Debt Sustainability section. This page draws on the P&L History tab; the interactive model below uses its FY2025 figures as the starting point.