
Gross U.S. federal debt reached $39.5 trillion in mid-2026[1], having closed fiscal 2025 at $37.6 trillion, or 122% of GDP.
Federal Debt vs. Nominal GDP
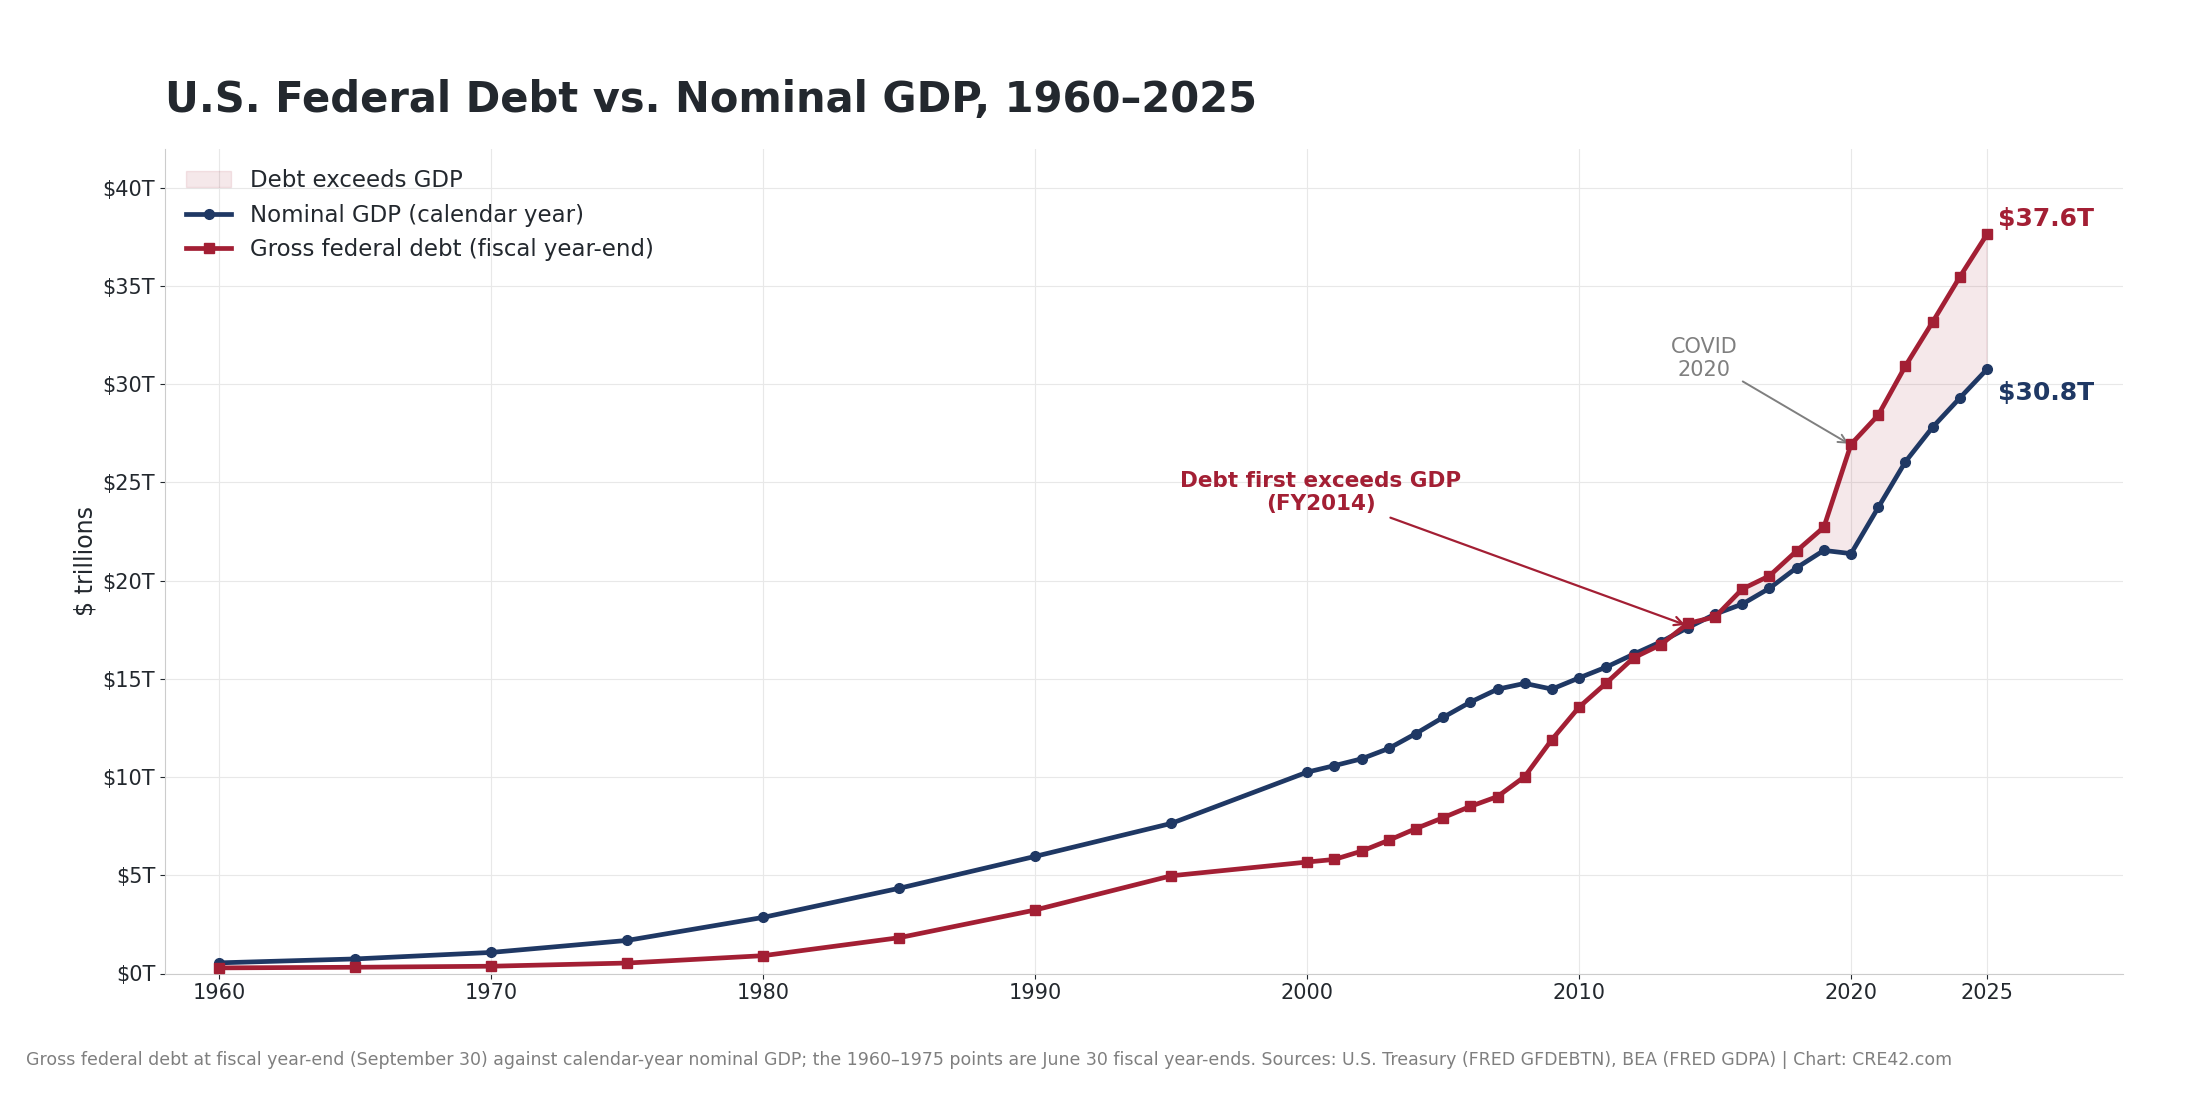
Gross federal debt at fiscal year-end (September 30) against calendar-year nominal GDP. The shaded area marks the years debt exceeded GDP. Sources: U.S. Treasury (FRED GFDEBTN), BEA (FRED GDPA) | Chart: CRE42.com
Debt first exceeded nominal GDP in FY2014, at 101% of GDP. It slipped back below in FY2015 and has been above every year since FY2016. The pandemic pushed the ratio to 126% in FY2020, its highest reading in the series and above the previous post-war record; it then fell back as nominal GDP rebounded faster than borrowing, and has been drifting up again since FY2023[2].
Key Observations
Annual Growth: Debt vs. Nominal GDP vs. Real GDP
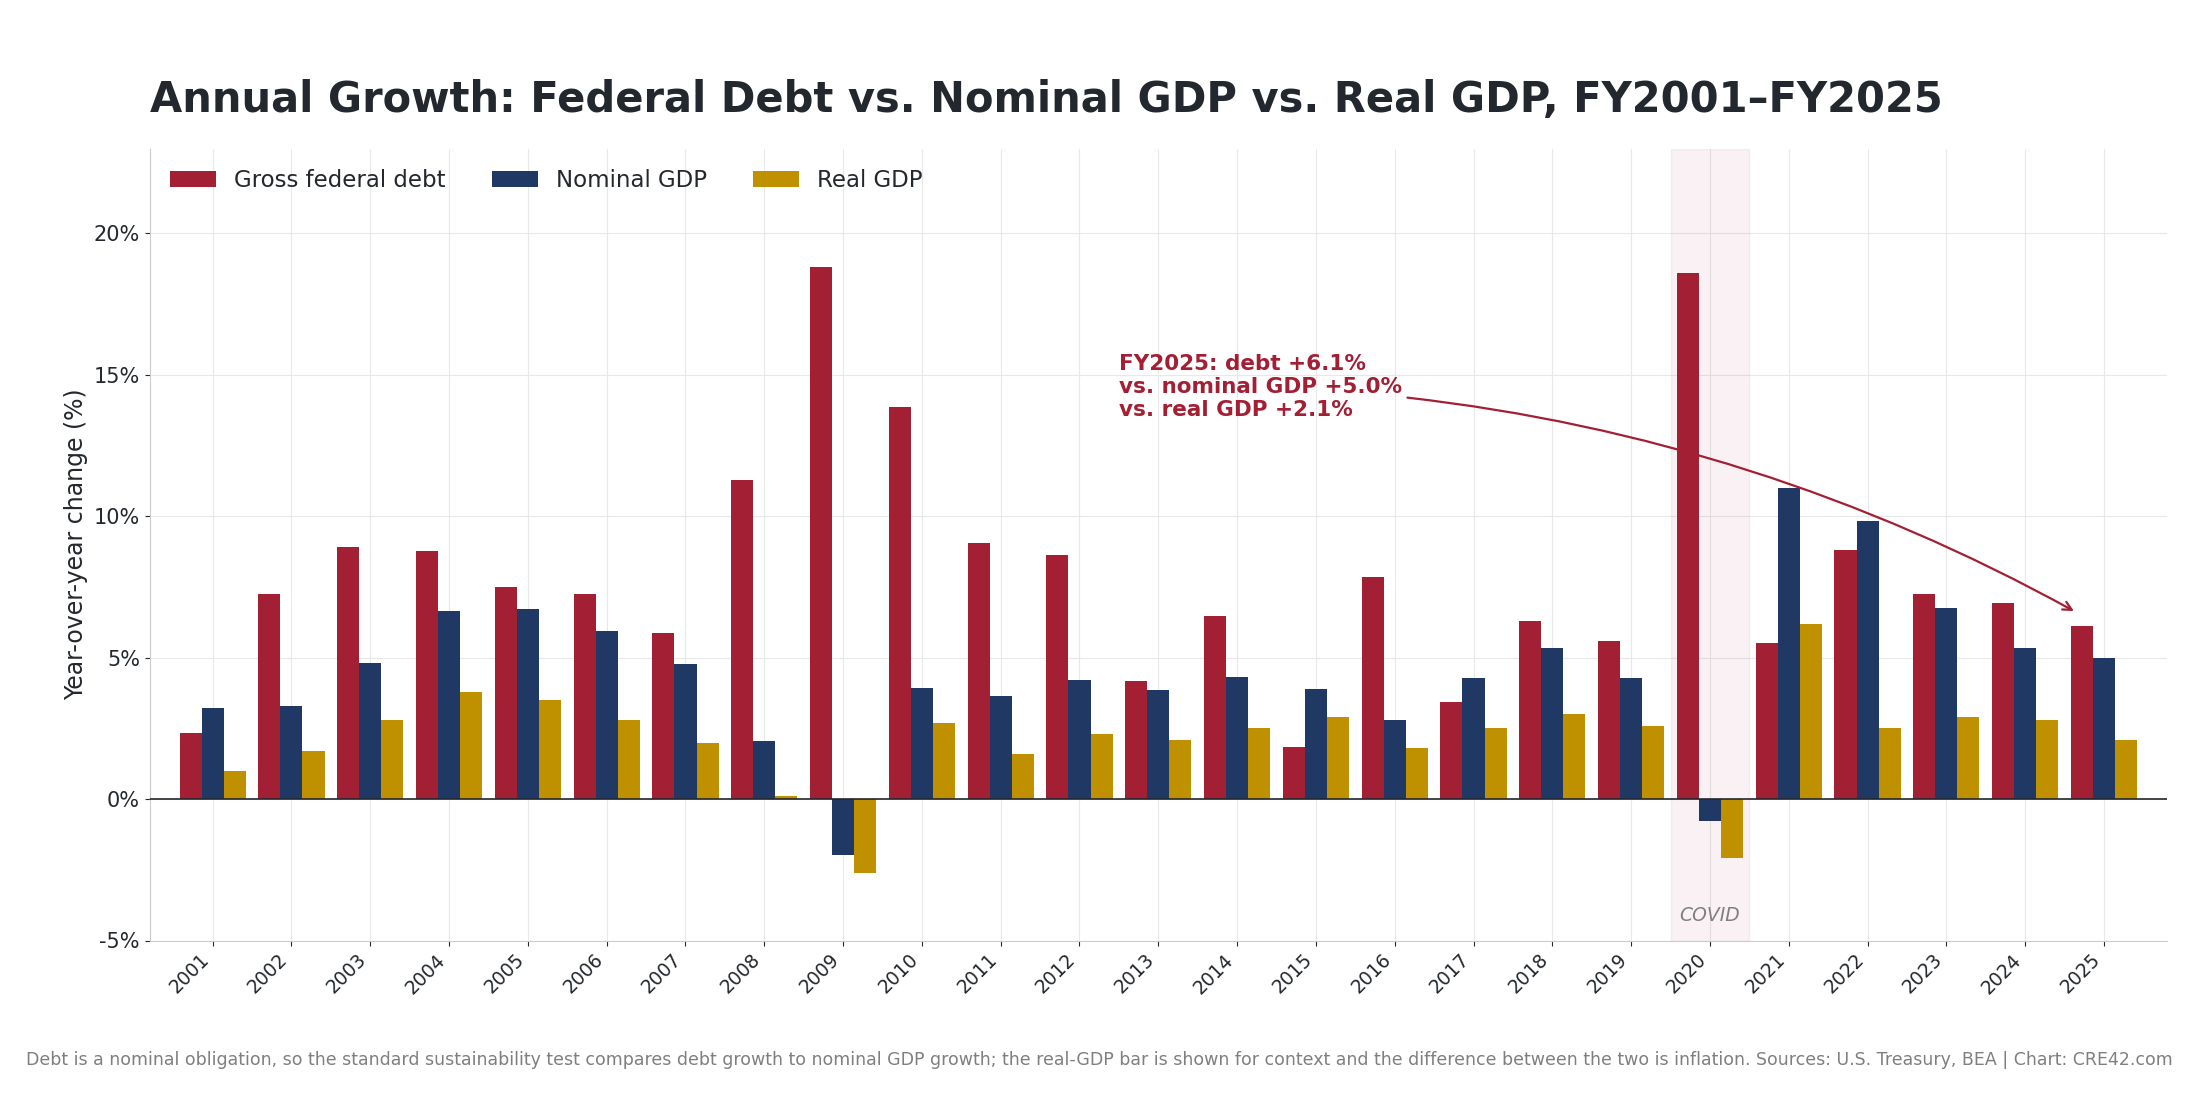
Debt is a nominal obligation, so the standard sustainability test compares debt growth to nominal GDP growth; the real-GDP bar is shown for context and the difference between the two is inflation. Sources: U.S. Treasury, BEA | Chart: CRE42.com
Gross Federal Debt as a Share of GDP
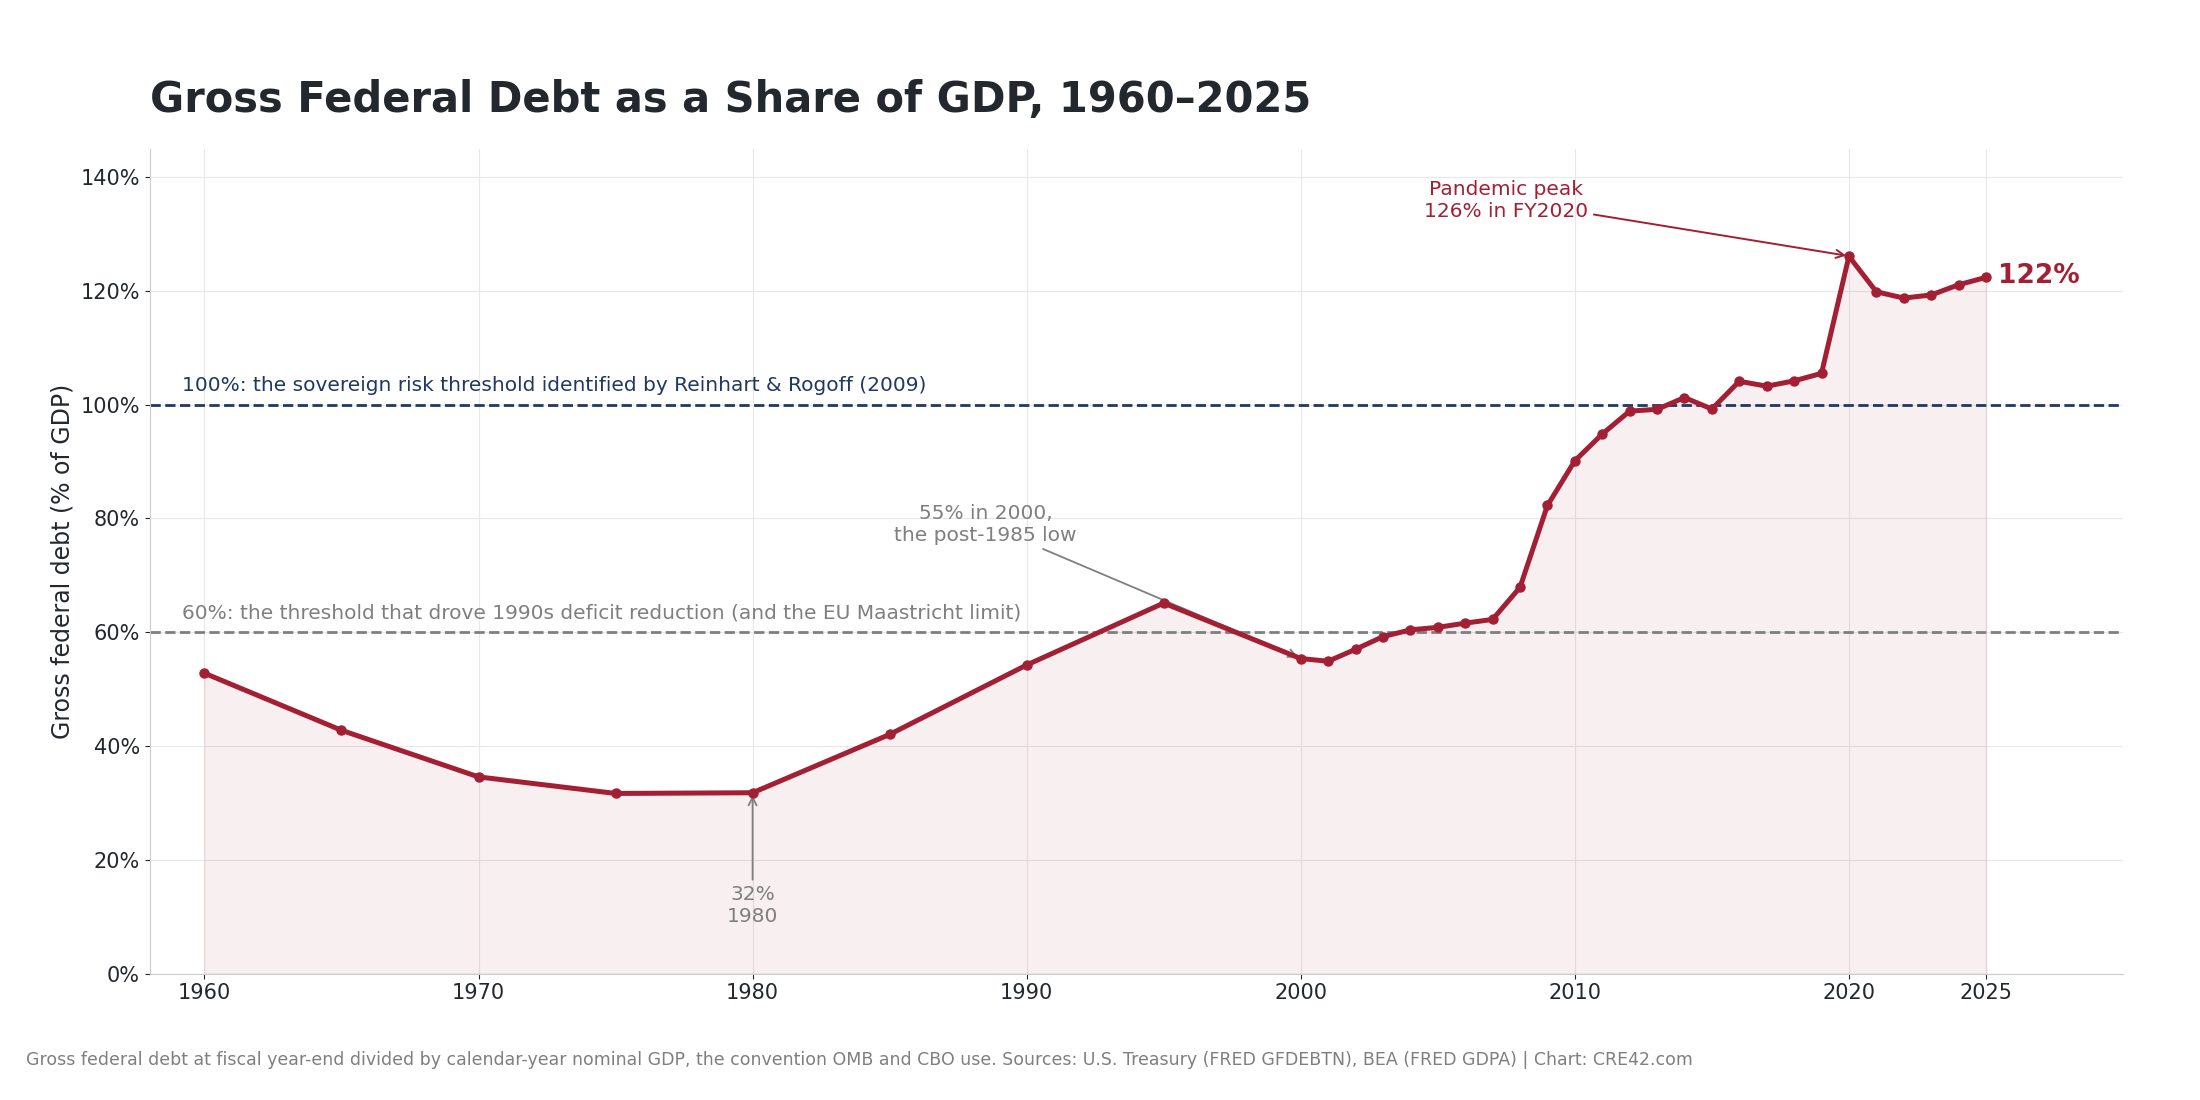
Gross federal debt at fiscal year-end divided by calendar-year nominal GDP, the convention OMB and CBO use. Sources: U.S. Treasury (FRED GFDEBTN), BEA (FRED GDPA) | Chart: CRE42.com
US Federal Debt: Historical Context
In their 2009 study This Time Is Different, Carmen Reinhart and Kenneth Rogoff examined eight centuries of sovereign debt crises. Their most relevant finding here: 84% of middle-income sovereign defaults between 1970 and 2008 occurred at external debt-to-GNP ratios below 100%. The U.S. figure of 122% is a different measure — gross federal debt to GDP, which includes intragovernmental holdings and is overwhelmingly owed to domestic holders in the country’s own currency — so the two numbers are not directly comparable; U.S. external debt is a much smaller share of GDP. The juxtaposition is directional, not a like-for-like threshold test.
However, the US is a high-income country, it issues debt in its own currency, and the dollar remains the world’s reserve currency. No defaulting sovereign in that dataset enjoyed any of the three. Outright default on Treasury securities is close to unimaginable for a government that can create the currency in which its obligations are denominated. The alternative adjustment mechanism, however, is inflation, and that is the channel through which federal debt reaches commercial real estate.
Commercial Real Estate Impact
Persistent deficits increase Treasury issuance, which exerts upward pressure on bond yields and, through them, on borrowing costs and capitalization rates. The 10-year Treasury yield has not fallen in step with the Federal Reserve’s short-rate reductions, which is consistent with a market pricing supply and inflation risk into the long end rather than pricing policy.
What to Watch For in 2026 and Beyond
Sources to Track Federal Debt and GDP:
| Source | Report or Series | Frequency | Notes |
|---|---|---|---|
| U.S. Treasury via FRED | GFDEBTN, total public debt | Quarterly | The debt series behind every chart on this page |
| U.S. Treasury | Monthly Statement of the Public Debt | Monthly | Current-period detail and the public vs. intragovernmental split |
| BEA via FRED | GDPA, nominal GDP; Table 1.1.1 for real growth | Quarterly, with annual revisions | The denominator; annual revisions restate prior years |
| CBO | The Budget and Economic Outlook | Annual, usually January or February | The ten-year deficit and debt projections cited above |
| OMB | Historical Table 7.1 | Annual, with the Budget | Gross debt on the budget basis, and the public vs. trust fund split |
Footnotes
[1] Gross federal debt of $39,462.4 billion at June 30, 2026 comprises $31,681.3 billion held by the public and $7,781.1 billion of intragovernmental holdings, the nonmarketable securities Treasury owes federal trust funds. Gross debt is the focal measure across this section; debt held by the public is the secondary measure and drives the debt-service arithmetic, since net interest is paid only on the public share. Source: U.S. Treasury, Monthly Statement of the Public Debt, June 30, 2026, Tables I and III. ↩
[2] All ratios on this page divide gross federal debt at fiscal year-end (September 30) by calendar-year nominal GDP, the convention OMB and CBO use in official publications. FY2025: $37,637.6 billion over $30,762.1 billion, or 122.4%. The FY2020 figure was corrected in the July 2026 workbook refresh to the September 30, 2020 balance of $26,945.4 billion; the earlier compilation had used the December 31, 2020 calendar year-end and produced a peak of roughly 132%. Sources: U.S. Treasury via FRED (GFDEBTN, June 18, 2026 update), BEA via FRED (GDPA, April 9, 2026 vintage). ↩
[3] FY2025 deficit of $1,775.4 billion per the Treasury final Monthly Treasury Statement (receipts $5,234.6 billion less outlays $7,010.0 billion). The OMB Historical Tables basis prints $1,774.7 billion for the same year; the difference is timing and coverage. CBO projections are from The Budget and Economic Outlook: 2026 to 2036 (February 2026): deficits of $1.9 trillion in 2026 (5.8% of GDP) rising to $3.1 trillion in 2036 (6.7%), cumulative deficits of $23.1 trillion over 2026 to 2035, and debt held by the public reaching 120% of GDP in 2036, surpassing its 1946 record of 106%. Note that CBO’s 120% is debt held by the public, not the gross measure used elsewhere on this page; debt held by the public equaled 98% of GDP at fiscal year-end 2025 on this page’s calendar-year GDP denominator (CBO and CRFB publish 100% for the same date using fiscal-year GDP — a denominator difference, not a data disagreement). ↩
[4] FY2025 net interest of $970.4 billion exceeded national defense outlays of $916.6 billion, both net outlays by budget function on the same basis (U.S. Treasury, final Monthly Treasury Statement FY2025, Table 9). Gross interest costs of approximately $1.2 trillion include interest credited to federal trust funds, an internal transfer that nets out of the deficit (U.S. GAO, Financial Audit: Bureau of the Fiscal Service’s FY2025 and FY2024 Schedules of Federal Debt, GAO-26-107908). The effective rate on the debt, at 3.3% in FY2025 against a 1.6% trough in FY2021, is analyzed on the Federal Deficit and Interest Rate Growth page. ↩
Sources
1. U.S. Treasury Department. Monthly Statement of the Public Debt, June 30, 2026. fiscaldata.treasury.gov
2. U.S. Treasury Department. Total Public Debt, FRED Series GFDEBTN. fred.stlouisfed.org/series/GFDEBTN
3. Bureau of Economic Analysis. Gross Domestic Product, FRED Series GDPA (April 2026 vintage). fred.stlouisfed.org/series/GDPA
4. Bureau of Economic Analysis. Table 1.1.1, Percent Change From Preceding Period in Real Gross Domestic Product (March 2026 vintage). bea.gov/data/gdp
5. U.S. Treasury Department. Final Monthly Treasury Statement, FY2025, Table 9. fiscaldata.treasury.gov
6. Congressional Budget Office. The Budget and Economic Outlook: 2026 to 2036, February 2026. cbo.gov/publication/61882
7. Office of Management and Budget. Historical Tables, FY2027 Budget, Table 7.1. whitehouse.gov/omb/budget/historical-tables
8. U.S. Government Accountability Office. Financial Audit: Bureau of the Fiscal Service’s FY2025 and FY2024 Schedules of Federal Debt, GAO-26-107908. gao.gov/products/gao-26-107908
9. Carmen M. Reinhart and Kenneth S. Rogoff. This Time Is Different: Eight Centuries of Financial Folly. Princeton University Press, 2009.
10. Olivier Blanchard. “Public Debt and Low Interest Rates.” AEA Presidential Address, American Economic Review, 2019.
11. CRE42.com Federal Debt Data Model. inflation-debt-in-context.xlsx, Historical Data and Growth Comparison tabs.
Methodology & Data Notes
Companion Workbook
inflation-debt-in-context.xlsx: companion workbook for the Federal Debt Sustainability section. This page draws on the Historical Data tab (debt, nominal GDP, the ratio and annual growth, 1960 to 2025) and the Growth Comparison tab (the three-way annual growth comparison, 2001 to 2025). Both tabs carry native embedded Excel charts.
Debt-to-GDP Calculation
Fiscal year-end debt (September 30) divided by calendar-year GDP. The three-month timing mismatch follows the convention OMB and CBO use in official publications. The 1960 to 1975 observations are June 30 fiscal year-ends, which is when the federal fiscal year ended before 1977.
Nominal vs. Real GDP
Debt is denominated in nominal dollars, so the standard sustainability comparison operates in nominal terms, the “r versus g” framework set out by Blanchard (2019). Comparing debt growth to real GDP growth implicitly ignores that inflation erodes the real burden of debt already outstanding. Both comparisons are carried in the workbook, with the nominal comparison labeled as the standard framework and the real comparison provided for context.
Which Debt Figure Applies Where
Three gross-debt bases run through this section by design and are reconciled on the Debt Comparisons tab: the Treasury MSPD current-period measure ($39,462.4 billion at June 30, 2026), the FRED GFDEBTN fiscal year-end series that drives this page’s ratios ($37,637.6 billion at September 30, 2025), and the OMB budget basis behind the receipts and outlays analysis ($37,375.0 billion, FY2025). No figure should be carried from one tab to another without restating its date and basis.
Reinhart & Rogoff Threshold
The 100% threshold referenced above comes from Reinhart and Rogoff (2009), whose finding was that 84% of middle-income sovereign defaults occurred below that level. Their ratio is external debt to GNP; the 122% cited on this page is gross federal debt (including intragovernmental holdings, overwhelmingly domestically held) to GDP, so the comparison is directional rather than like-for-like. Their separate 2010 paper, “Growth in a Time of Debt,” argued that GDP growth slows above 90% debt-to-GDP; that specific result was contested after Herndon, Ash and Pollin (2013) identified a spreadsheet error. The broader qualitative finding, that very high debt levels are associated with elevated sovereign risk, remains widely accepted, and it is the 2009 default finding rather than the 2010 growth finding that is cited here.
Retired Content
The debasement trade section (gold, silver and bitcoin indexed performance, compiled February 2026) was removed from this page on July 30, 2026, along with the corresponding workbook tab. The material addressed asset-price behavior rather than debt sustainability and sat outside the scope of this section.